
The Costs and Benefits of User Input in Design Process
This journal was supported by National Research Foundation of Korea Grant Funded by the Korean Government(MEST)
이 학술지는 2013년도 정부재원(교육과학기술부)으로 한국연구재단의 지원을 받아 출판되었음
User input and feedback during different phases of an assistive technology design project can be of great importance to the designer. The lack of user input can lead to critical time and cost-consuming changes in the product development process. Since the available user input information is not always applicable to each design phase, an organized method is necessary in order to determine when user input is required. In this research, the design structure matrix method is used to identify and group tasks that are highly correlated. This grouping and partitioning procedure can facilitate the identification of key tasks that require user feedback and inputs in the design process. The Markov chain analysis is introduced to determine the duration of execution of the tasks and the order in which tasks are executed in the design structure matrix. After demonstrating the developed procedure with numerical examples, an assistive technology device development problem, namely an alternating pressure wheelchair seat cushion design, is presented in this paper.
Keywords:
Assistive Technology, Design Structure Matrix, Markov Chain Analysis, Wheelchair1. Introduction
One of the important activities in the development of a new product is to collect user needs and preferences. This is evident in a variety of different approaches that are utilized to gather and address preferences within the design process. There are many factors that can hinder the effectiveness of the collected information during the design process [1]. For instance, gaining an understanding of a user’s needs can be a challenge for a designer. Designers tend to imagine themselves in the shoes of users. They can try to design as if from an end user’s perspective so that the final product, ideally, performs a task in a way that works best for the user [2]. Unfortunately, designers are not typical users. Designers tend to be experts of the device or developing product, while users tend to be experts at performing the task that the product is meant to help perform. Therefore it is critical to reflect appropriate users' needs and preferences to ensure the success of product development.
This situation becomes more complicated in the design of an assistive technology (AT) device. In the development of AT devices, a designer who is not disabled themselves may have to overcome a very wide experiential gap when designing an assistive product. Users of AT products represent a wide continuum of abilities [2] from those with slight to moderate disabilities who may have more general needs to those with more severe disabilities who may have very unique and specific needs. As a result, an AT device may function well for one group of users but poorly for another group. The result of this continuum is that many markets for AT products tend to be small, niche markets [3, 4]. Thus, the need to fit the user is important in the design of most products and particularly in AT products.
Early inclusion of users’ needs in the early design stages can be most valuable, since changes in the design at later stages can be time consuming and expensive to implement [5]; therefore, many strategies for including users’ feedback in the design process have evolved over time to address this issue in AT device developments. These strategies generally consist of engaging users in one of three roles in the development of new products: 1) listening into the customers domain, 2) asking customers questions, and 3) building with customers [6].
Listening into the customer domain involves collecting needs via an understanding of the market, such as from research reports, feedback from sales people or examining sales data. Asking customers questions involve surveys or interviews, where designers are often quite separated from the users. Information is filtered by many organizational layers before actually reaching the designer [7]. For example, quality function deployment (QFD) users are only involved during the initial needs gathering to generate the design requirements [1]. The ‘voice of the customer’ is later represented during design process by quotes and comments about particular features provided at the beginning [4]. This is true not only in QFD, but also in other commonly used design methods such as stage gate [8] or agile development [9].
Building with customers involves actively including users in the design process during the development of solutions. It can help the users by seeing something realistic, since users are generally not good at visualizing a product based on an abstract concept [10]. The user can feel and experience the product directly. It allows more accurate evaluations to be conducted [11]; however, they are often not available until much later in the design process, where changes are more difficult to make.
None of these strategies clearly address how users might be efficiently engaged during design process. Generically, designs proceed through several phases including 1) Idea Generation, 2) Concept Development, 3) System Design, 4) Detail Design, and 5) Manufacturing [12, 13]. A product may enter a trial phase before manufacture, although this is generally to test marketing, packaging, etc., rather than serious design changes to the product[6]. Users are typically involved more heavily on the front-end (idea generation, needs specification) or the back-end (validation and testing) of the design process.
This leaves an important portion of the design process without user feedback and input.
The main goal of the presented research is to investigate how to manage users' feedback in the design process such that we identify the ideal design process which utilizes user's needs and preferences efficiently to minimize the costs of the product development. The paper discusses the use of the design structure matrix (DSM) to help in grouping and identifying tasks that will require users’ feedback. Since the tasks are interdependent on each other, the ordering of the tasks can affect the progress of the design process. Thus, the Markov chain analysis [14] and an eigenvalue analysis [15] are introduced to determine the best ordering of the tasks that will result in minimum rework. The details of the DSM, Markov chain analysis, and eigenvalue analysis are discussed in the following sections. Demonstrating the developed procedure with a numerical example and a practical design problem of an AT device provides clear guidance of how we reduce the cost of designing AT devices by efficiently reflecting users’ feedback.
2. Solution Methods
A. Design Structure Matrix
A useful tool for determining how to schedule user input during a design project is the Design Structure Matrix (DSM). DSM has been utilized in project management as well as design process [16-18]. It was first utilized to help find the best way to order a set of tasks based on their dependencies with each other [19]. It has been expanded by many researchers and was used in various applications [14].
There are three types of tasks in a DSM. These tasks differ in their dependency or coupling type. Fig. 1(a) shows the first type, which are dependent tasks (series tasks). For instance, Task A is required in order to Fig. 2(a) shows a typical DSM example.

DSM tasks types (a) Dependent tasks (series) (b) Independent tasks (parallel) (c) Interdependent tasks (coupled)
The tasks are arranged in the original intended order of execution. The diagonal elements of the matrix show the number of the task. The off diagonal elements of the matrix show the dependency of each task. The rows of the matrix show from which task the matrix row requires information from. This is shown by placing a “1” in the cell corresponding to the task that the row requires information from. The columns of the matrix show the tasks that supplies information to the rows.
Elements below the diagonal of the matrix show dependency on tasks that were completed. While the elements above the diagonal show dependency on tasks that have not started yet. A method called partitioning [20] in DSM can be performed on the data in order to identify the groupings of highly related tasks. Fig. 2(b) shows the partitioned matrix which portrays the grouping of the tasks that are shaded. The grouping is important for this discussion as it indicates points where the insertion of input may be useful. It also provides a more accurate way to estimate the amount of time necessary to complete a set of tasks. As shown in Fig. 2(b), Tasks A, D, and E are interdependent tasks and Tasks C and B appear as the series tasks (dependent tasks).

DSM layout (a) Unpartitioned matrix (b) Partitioned matrix
B. Markov Chain Analysis
Markov chain, named after Andrey Markov, is a stochastic method that shows the transition from one state to another, where only the present state (not the past state) is what effects the transition to the future state. It operates in discrete time intervals in discrete state space [21]. In order to apply Markov chain analysis on the DSM, the DSM should be appropriately modified. The modified matrix is called the Work Transformation Matrix (WTM). The modification is done by adding estimations of the total time needed to perform the task along the diagonal of the matrix and replacing the dependencies with the probability that the task will need to be re-worked.
Fig. 3 shows the modified DSM with its off-diagonal elements replaced with probabilities of rework and the diagonal elements with the estimated time to finish the task with no re-work. Fig. 4 shows the reward Markov chain for ordering of this matrix. It shows that the tasks can be done in two stages (the number of stages is the same as the number of tasks).

Work transformation matrix
The total time required to finish these tasks depends on which tasks the designer starts from. The time required to finish the 1st stage is either x if the starting task was A or y if the starting task was B. To calculate the time spent on the 2nd stage, the resulting system of linear equations represented by the matrix can be analyzed mathematically as a reward Markov chain.
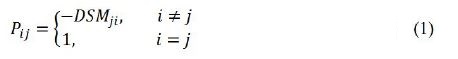
This is done by constructing the reward Markov chain matrix P by taking the transpose of the WTM (Fig. 3) and changing the sign of the off-diagonal elements and replacing the diagonal elements with 1:
The removed diagonal elements are placed in a separate vector b,

The unknowns are the time spent on Tasks A and B are placed in a vector r such that:

where b and r are called the remaining time vector and the total time vector, respectively.

Reward Markov chain for the 2 x 2 matrix
Using Gaussian elimination, the time spent in the 2nd stage can be calculated (if Task A was the starting task, then the required unknown in the system of equations is the time spent on Task B and vise-versa).
If there were more stages then the time spent on each stage needs to be calculated in order to obtain the total time. Various algorithms [14] can be used to calculate the total time for all tasks. Since the earlier stages are a subset of the later stages, the P matrix is factorized using Gaussian elimination to an L, D and U matrices (lower triangle, diagonal, upper triangle matrix) such that P = LDU. Then the remaining time vector for all stages, x, is calculated as:

C. Minimum Length Ordering
The order in which task is executed in the design process can affect the total
time spent on the design process [14]. A heuristic search algorithm can be
used to determine the best and worst ordering of the tasks [15]. Also, the
evaluation of the eigenvalues,
 , and eigenvectors, S, of the WTM (replacing
the diagonal elements with 0) can be used to identify the best ordering of
the tasks. For instance, if the matrix has linearly independent eigenvectors
(eigenvector matrix S is invertible), then the total work vector can be calculated as:
, and eigenvectors, S, of the WTM (replacing
the diagonal elements with 0) can be used to identify the best ordering of
the tasks. For instance, if the matrix has linearly independent eigenvectors
(eigenvector matrix S is invertible), then the total work vector can be calculated as:

where U is the total work vector u0 is the initial work vector (u0 = 1). By
inspection of (1 –
)-1, (1 –
)-1 S-1 u0 and U , it is possible to rank which
task will have more contribution than the other. A detailed example will be
shown in section 3. In this research, both the heuristic search algorithm
and eigenvalue analysis of WTM will be utilized and compared to find the
best ordering of the tasks. The corresponding discussions concerning the
procedure will be provided.
3. Result: Demonstration Examples
A. Numerical Application
Fig. 5 shows a typical DSM. It has a set of tasks; namely, A to G. The calculation of the duration to complete all these tasks is accomplished by partitioning the DSM to identify the coupled tasks [20]. Fig. 5(b) shows the corresponding partitioned matrix. The coupled tasks are A, C, E, F and G. Tasks D and B are series tasks, i.e., starting with Task D then Task B is followed. Of course, Task D does not require any information from Task B.
To calculate the time required for coupled tasks, the DSM is modified as the WTM as shown in Fig. 5(c).

An example of a DSM (a) Initial unpartitioned matrix (b) Modified matrix (c) Partitioned matrix
The resulting system of linear equations represented by the coupled matrix can be analyzed mathematically as a reward Markov chain to calculate the expected duration to finish these tasks. Fig. 6 shows the reward Markov chain of the tasks from Task A to the end of the processes. Since there are 5 tasks, the chain is divided into 5 stages. In order to calculate the time required to finish each task, the Markov chain can be written as a set of linear equations for each one of the 5 stages shown.

Markov chain for the processes from Tasks A to G
For the 5th stage for example, the resulting system of equation becomes:
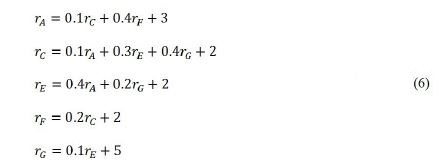
where, rA, rC, rE, rF and rG are the expected remaining time at each node in the 5th stage. In matrix form, the system equation results in,
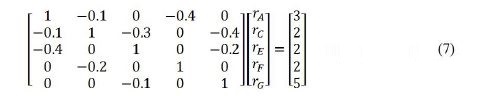
This linear system of equations (7) can be solved using Gaussian elimination. For instance, since the last task remaining in the 5th stage is task G, then the remaining time for Task G is the required unknown which gives that rG = 5.51.
Applying the same procedures (6-7) to the stages before stage 5, and solving the system of equations will give the time spent, S , on each task. For this example, SC, SE, and SF are obtained as 2.32, 3.33 and 2.72, respectively. The time spent on Task A is the same time required to finish Task A with no rework. Thus, the total time to finish all these tasks is 16.88 days.
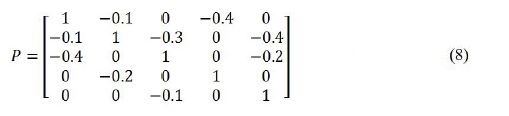
The same results can be obtained by using the heuristic search algorithm [14] to calculate the total time required. First, the reward Markov chain matrix P is constructed by using (1),
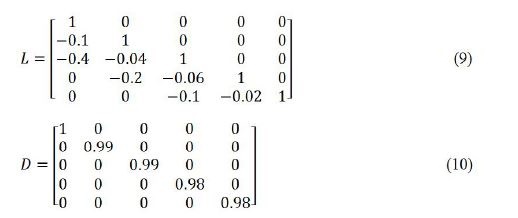
Then, it is decomposed using Gaussian elimination and the lower and diagonal matrix is obtained,
The remaining time vector, x', is then obtained as:
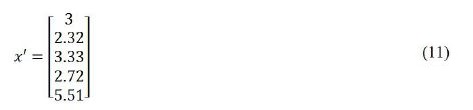
Summing up the elements in the x' vector gives 16.88 days.
To determine the minimum and maximum ordering times, the heuristic search method [14] can be applied. For this example, the best ordering was obtained as E, C, A, F and G which results in 16.16 days, while the worst ordering is A, F, E, G, and C which results in 21.43 days.
Further investigation using the eigenvalues of the DSM can be performed.
For the given example, the eigenvalues
and eigenvectors S are obtained
as:
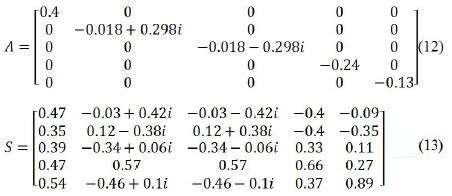
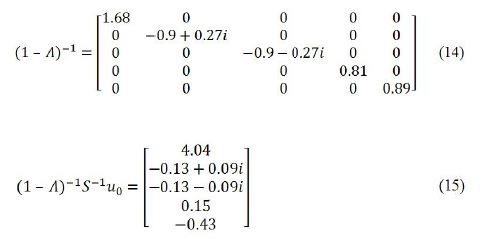
By calculating the term (1 –
)-1 and inspecting the elements, it is shown
that the first mode will have more contribution to the total work, since it has
the largest value. In addition, by inspecting the term (1 –
)-1S-1U0 , it is
clear that the first mode has the largest value when compared to the other
modes. By inspecting the elements of the first mode in S, it can be deduced
that the first and last task will have more contribution to the total work
vector.
The total work vector U is then calculated and it shows that the total work done by each task is related to the eigenvector of the first mode.
Ordering the tasks from the least contribution to the one with the most contribution gives that the best ordering is C, E, F, A and G. But this does not give the optimum ordering as the heuristic search algorithm, since this ordering gives a total time of 17.51 days. Thus, it is recommend to try both the heuristic search algorithm and eigenvalue analysis method, and the user should select the ordering with the minimum required time.
B. Design Problem of an Alternating Pressure Seat Cushion of a Wheelchair
A project to design and build a AT device; namely, an alternating pressure seat cushion of a wheelchair (Fig. 7), is analyzed to evaluate the potential benefits of the applied procedure (Section II) to aid in the scheduling of user input to reduce the cost required in the product development. The idea behind of the product is to produce a seat cushion that can both dynamically alter the loading on the buttocks and control the microclimate of the buttocks-cushion interface. The microclimate is regulated by an air pump which circulates air and controls heat and humidity of the interface as shown in Fig. 7.

Prototype of alternating pressure wheelchair seat cushion
Although the basic requirements for the cushion are clearly defined, the design activities that would need to be carried out to produce the product are not. This lack of definition is one of the main problems for scheduling user engagement. The design team could anticipate some aspects of the design that would require extensive user testing and input, such as the seat cushion itself and the operational controls that the user would use to alter the loading on the buttocks when seated. However, it is not clear when this input would be required or if there are other important aspects of the design which might require or benefit from additional input during the design process.
The key members of the design team were engaged in order to bring more definition to these tasks. The first step was to define the tasks that were anticipated in order to develop the required functions (Table I). These design team members were first interviewed as a group in order to define these. After the tasks were defined, the next step was to identify all of the dependencies between the tasks, the likelihood of re-work, and estimated task duration. The tasks were laid out in a DSM-like square matrix (Fig. 8) prior to meeting the design team members. Each team member was met individually and asked to sequentially review each of the tasks defined on the left-hand side of the matrix and mark any dependency that the task had on any other task. The matrix was then partitioned (Fig. 9) and the re-work probabilities were estimated. In order to do this, the team member reviewed each of the dependencies in the matrix. Finally, the team member was asked to estimate how long it would take to perform the design task by itself (with no re-work). This value was defined in days and placed along the diagonal for each task. The dependencies, re-work probabilities, and task durations in the matrix were used when interviewing the next team member. The same exercise of defining dependencies, probabilities and task duration was performed. Any new dependencies were added directly to the matrix. If any disagreement or questions about existing values arose, these were recorded separately and the disagreement highlighted in the matrix by highlighting the cell. After each member was interviewed individually, the team was interviewed again as a group in order to resolve the discrepancies found in the individual interviews. For each difference, the group discussed and agreed on an appropriate value which was then entered into the task matrix.

DSM for the task of the wheel chair cushion

Design Tasks of the Alternating Pressure Wheelchair Seat Cushion.

Partitioned DSM of the wheel chair cushion
There were a wide range of possible times for each of the groups of tasks, depending on the order in which they were arranged. The heuristic search program was designed to keep track of the longest and shortest of the orderings during the search. Each of the main groups of tasks was given a name for ease of reference. For example, the first task group in Table II consisted of the tasks required in order to determine the specific properties of the internal and external materials:
∙ Determine outside material type (40)
∙ Determine foam heat conductivity (45)
∙ Determine foam stiffness (48)
∙ Determine foam resilience (49)
∙ Determine foam density (50)
∙ Determine foam type (reticulated vs. typical) (51)
To calculate the optimum ordering for these tasks, the WTM shown in Fig. 10 is obtained and transformed into a reward Markov Chain matrix. Then, the heuristic search algorithm and eigenvalue analysis are applied to obtain the best and worst ordering days for the tasks.

WTM for the first group of tasks
The best ordering for these tasks was 3, 5, 4, 2, 1 and 6 which gives 23.1 days. And the worst ordering was 3, 1, 5, 4, 6 and 2 which gives 26.4 days.
The same calculations were applied on each group in the DSM. The least efficient ordering along with most efficient ordering calculated during the analysis is shown in Table II for all the groups.
Execution Time of Best and Worst Task Orderings Evaluated by the Heuristic Search.
4. Discussion
The DSM analysis of the seat cushion development project shows several potential advantages. First, potential reduction of the time needed to perform a project by properly ordering the tasks can be achieved. In the presented example, ordering tasks within blocks differently can lead to a difference of 44.6 days, or just over 10% as shown in Table II. Close inspection shows that two of the blocks, “Design occupancy switch (Task 6)” and “Software program design (Task 7)”, are actually single tasks. Both of these, particularly the software design, would almost certainly require more than one task to perform which may have dependencies on existing tasks. This does not necessarily pose a problem since tasks within the larger blocks have dependencies on one another as well. Non-iterative dependencies will tend to move the entire block earlier or later in relation to the others. Second, the analysis gives an indication of the best times to potentially solicit inputs from users. Recall, users are not particularly good at imagining and providing accurate opinions on imagined objects. But if users are engaged at the completion of a module, the required design tasks will be completed and there can be a concrete artifact for the user to evaluate. In the AT device example, a user might provide direct feedback on the foam and cover materials that are chosen or the operation of the pump and mechanical components after they have been integrated. This provides the design team with necessary input at the time which is actually needed so that the solution can be best fit to the need.
Because the overall time for each module can be estimated, intelligent decisions (based on cost, available time, etc.) can also be made on the quantity of input to be solicited during design process. In this case, it may not be reasonable to engage users immediately after designing the major mechanical components. They are unlikely to be very comprehensible to a user until after the next set of tasks that integrate the electrical and mechanical components with one another. It would make sense to ensure that an evolving solution is acceptable to users at this point before continuing on to later tasks.
After the analysis was performed, some additional observations for input can be identified. It became clear that inputs after completing the second task group would be useful. This would ensure that decisions made to satisfy the technical requirements (internal bladders, internal and external materials) were also acceptable to users. This would allow acceptable changes to be made before later tasks were performed which depended on the attributes of these decisions. It was also clear that the occupancy switch would be a good time for additional input. The occupancy switch is the system that automatically detects the presence of a user and initiates the pre-programmed operation of the cushion. In both of these cases, the additional input was felt necessary due to the large number of dependencies of later tasks. In other words, if these components were not designed in a way that was acceptable to the end users, then any problems requiring them to be reworked would set off a kind of chain reaction requiring all of the later tasks to be re-worked as well.
The initial partitioning organized the tasks into groups roughly corresponding to modules within the design. A modular design, where the modules are parts of a larger system that are independent of one another but work together, is highly desirable [22]. Breaking a problem down into smaller independent pieces also reduces the overall complexity of the problem and makes the individual pieces easier to solve [23]. Although the task definitions used in the analysis were relatively high level, they were specific enough to clearly define all of the steps that must happen during design. This of course is helpful from a management standpoint (not only for identifying when to begin planning for input but also for things like design resource allocation). The general architecture of the product had been defined prior to the defining the individual design tasks. However, defining the design tasks in conjunction with all of the major decision makers allowed discussion and consideration of different approaches for implementation. During the group meetings, after the task dependencies, re-work probabilities and task durations had been defined, some further discussion of task definition took place. The focus was on reducing, as much as possible, dependencies that were above the diagonal in the matrix. These denote iteratively dependent tasks and wherever these could be removed by re-defining the task plan, the more serial and less complicated the design plan would be. Great focus was not placed on this activity, however minor changes in approach were agreed upon which removed some unnecessary inter-dependencies.
Finally, the developed DSM analysis can be usefully applied with a wide range of existing design methods. Organizations learn how to do things better over time. This organizational learning includes a company’s managerial and technical systems that make up an organizations values [10]. This internal knowledge can help to provide companies with competitive advantages within particular markets. Large changes to these workings can undermine these advantages. For example, a company that utilizes a method such as QFD for engineering design will not likely adapt easily to a fully customer co-creation type model. A DSM type approach might be used during early project planning in addition to existing and proven processes so that more direct customer involvement might be included in a useful manner.
5. Conclusion
Analysis of a design project via DSM along with Markov chain analysis appears to have a number of advantages to the management of design in general and AT design in particular. It can be used to estimate the actual time needed to perform the tasks in a design project of AT devices with the consideration of re-work effects. The demonstrated framework can be used as a planning tool to investigate the impact that different design approaches may have on the overall project. In addition, it can also be used to optimize the task orderings of a design project and indicate specific points where additional user engagement can be useful. Further development is necessary in order to develop a way to use this framework to make intelligent decisions on when and how much input is actually needed. This will need to be based both on design and organizational factors. The presented work in this paper can be a clear guidance of how we apply the DSM and Markov chain analysis to determine the optimal task ordering and to identify user engagement points in the design process of the AT devices in which the user feedback is critical.
Notes
This is an Open Access article distributed under the terms of the Creative Commons Attribution Non-Commercial License (http://creativecommons.org/licenses/by-nc/3.0/), which permits unrestricted educational and non-commercial use, provided the original work is properly cited.
References
- Alexander, C. (1964). Notes on the Synthesis of Form (Vol. 5). Harvard University Press.
- Baldwin, C. Y., & Clark, K. B. (2000). Design rules: The power of modularity (Vol. 1). MIT press.
- Beck, K., Beedle, M., Van Bennekum, A., Cockburn, A., Cunningham, W., Fowler, M., ... & Thomas, D. (2001). Manifesto for agile software development.
- Cook, A. M., & Polgar, J. M. (2013). Cook and Hussey's assistive technologies: principles and practice. Elsevier Health Sciences.
-
Cooper, R. G. (1990). Stage-gate systems: a new tool for managing new products. Business horizons, 33 (3), 44-54.
[https://doi.org/10.1016/0007-6813(90)90040-I]

- Cowan, D., & Turner-smith, A. (1999). The role of assistive technology in alternative models of care for older people, in 26. In Research, HMSO.
- Cross, N. (2008). Engineering design methods: strategies for product design. John Wiley & Sons.
-
Eppinger, S. D. (1991). Model-based Approaches to Managing Concurrent Engineering. Journal of Engineering Design, 2 (4), 283-290.
[https://doi.org/10.1080/09544829108901686]
- Eppinger, S. D., Whitney, D. E., Smith, R. P., & Gebala, D. A. (1994). A modelbased method for organizing tasks in product development. Research in Engineering Design, 6 (1), 1-13.
- Harwin, W. S. (1998). Niche product design: A new model for assistive technology. Technology for Inclusive Design and Equality (TIDE), Helsinki.
-
Kaulio, M. A. (1998). Customer, consumer and user involvement in product development: A framework and a review of selected methods. Total Quality Management, 9 (1), 141-149. Helsinki.
[https://doi.org/10.1080/0954412989333]
-
Leonard-Barton, D. (1992). Core capabilities and core rigidities: A paradox in managing new product development. Strategic management journal, 13 (S1), 111-125.
[https://doi.org/10.1002/smj.4250131009]
- McGrath, M. E., Anthony, M. T., & Shapiro, A. R. (1992). Product development: Success through product and cycle-time excellence, 260 (-). Amsterdam, the Netherlands: Butterworth-Heinemann.
- Norman, D. A. (2002). The design of everyday things. Basic books.
-
Page, A. L., & Rosenbaum, H. F. (1992). Developing an effective concept testing program for consumer durables. Journal of Product innovation management, 9 (4), 267-277.
[https://doi.org/10.1111/1540-5885.940267]
- Pierre Bremaud. (1999). Markov chains: Gibbs fields, Monte Carlo simulation, and queues (Vol. 31). springer.
- Piller, F. T., Ihl, C., & Vossen, A. (2010). A typology of customer co-creation in the innovation process. Social Science Research Network. Retrieved Dec, 29, from SSRN: http://ssrn.com/abstract=1732127.
-
Smith, R. P., & Eppinger, S. D. (1997). A predictive model of sequential iteration in engineering design. Management Science, 43 (8), 1104-1120.
[https://doi.org/10.1287/mnsc.43.8.1104]
-
Smith, R. P., & Eppinger, S. D. (1997). Identifying controlling features of engineering design iteration. Management Science, 43 (3), 276-293.
[https://doi.org/10.1287/mnsc.43.3.276]
-
Steward, D. V. (1981). The design structure system- A method for managing the design of complex systems. IEEE transactions on Engineering Management, 28 (3), 71-74.
[https://doi.org/10.1109/TEM.1981.6448589]
-
Tang, D., Zheng, L., Li, Z., Li, D., & Zhang, S. (2000). Re-engineering of the design process for concurrent engineering. Computers & Industrial Engineering, 38 (4), 479-491.
[https://doi.org/10.1016/S0360-8352(00)00059-0]
- The Design Structure Matrix Homepage. (2006). Retrieved From http://www.dsmweb.org.
- Ulrich, K. T. (2003). Product design and development. Tata McGraw-Hill Education.