Using Morphological Chart for Analysing Existing Designs
Abstract
Background Morphological chart (MC) is a design method used for finding many solutions to a defined problem. The solutions depend on deconstructing the problem to its sub- functions and generating alternatives to these sub-functions. It is implemented in the form of a grid. Although the method works on dividing the problem and then offering solutions piece by piece; the pieces are combined through a selective process and integrated in the end. The overall nature of the method depends on problem solving and generating an analytical framework to be able to comprehend the whole universe of solutions.
Methods In this study, MC is used to analyse existing designs in a systematic way. This use is demonstrated through a study, using the outputs of a foundation course in design, which involves more than 300 students’ designs. This design data is evaluated and visually summarised with a created morphological chart.
Results Sub-functions and sub-solutions of the students’ designs are explored through their design presentation boards. This data formed a matrix, with sub-functions listed vertically while their corresponding solutions are placed horizontally. That matrix is the morphological chart of these designs.
Conclusions Necessary steps to follow in order to construct a MC for analysing existing designs are defined in this study. This use of the MC can enable easier market research, visualization of design data, and the output which is the morphological chart itself can be used as an input for both idea creation methods for designers, and it can be transferred to a spreadsheet as the input of a computer-generated design software or artificial intelligence applications.
Keywords:
Morphological Chart, Idea Generation, Design Methods, Design Analysis, Structural Problem1. Introduction
Design methods are of the main topics of design research. Design methods are the methods used by students and professionals to design an object, service etc. Use of these tools and methods is not obligatory, however, it helps designers to find different solutions, create different designs and analyse different options for a final product. These methods are used in different stages of the design process. While some methods are specific to the step in the design process, others can be used in more than one stage in designing.
Idea generation is critical in the initial stages of the design process, such as the conceptual design stage, where many solutions are explored and create a comprehensive design space (Bayırlı and Böekçi, 2022). During this phase, designers create different designs, with the help of the idea generation methods and tools. The quantity of designs is important at this stage rather than quality. Many ideas are visualised in some manner, generally through sketching, and these designs or ideas are unrefined at this stage. These ideas are then sorted, eliminated and the ones that have gotten through these processes are refined and developed. Novel ideas, which are new and different ideas, are generated at this stage of the design process. Idea generation methods and tools are not limited to a certain design field or the application these design fields or disciplines already have. They can be changed, refitted, and reorganised in order to meet other needs. The greatest example for that would be brainstorming, which is used not only in design, but also in marketing, engineering, marketing, sales etc. All these different fields/teams use this method with slight differences, but with the same goal: coming up with a number of ideas quickly.
The stage where the method is used can also change if the method allows the user to do so. An idea generation method or tool can be used in a later stage for innovation, or even, can serve another purpose, in the following case, analysis.
This research was initiated by the need of analysing the design data of more than 300 students in undergraduate-level design education. The main reason for an analysis is the observed differences in form finding methods among students from different design disciplines. In order to analyse the design data, this data needs to be converted. A search for a method to convert the design data into data that can be used statistically, resulted in reinstitution of an idea generation method. In this research, morphological chart (MC), which is essentially an idea generation method, is used as an analysis tool for this design data, tea tray designs of the students. To explain the reversion of the method, steps of constructing an MC for idea generation are explained first, then the steps that need to be taken for creating an MC for analysing existing designs are given. After that, the study, conducted in Istanbul Technical University Faculty of Architecture and resulted in the design data, is explained and the implementation of morphological chart for analysis is exemplified. Since this data includes many design samples, determining the sub-functions and listing their solutions; therefore, pointing out the differences between designs/products has been the goal of this study. However, in this paper, the preparation for analysis which is creating the morphological chart with these designs are discussed, since this is a paper about the method creation/alteration for analysing products/designs.
Purpose of this study is to find a new way to convert design data to analyse the design outputs; whether they are already made products/objects, or they are designs/sketches/visual representations of design ideas.
The importance of the specific case in this study lies in the unrepeatability of the study and the large number of samples in the data. Data was gathered from an experimental course syllabus that was only applicable for two years in Istanbul Technical University. Data consists of 300+ different designs made by that many design students. Therefore, the data is efficient for such method creation and alteration.
In the following section of this research paper, morphological chart as an idea generation method will be mentioned and the reason for selecting morphological charts for analysing design data will be explained. Also, similar studies are examined in this section. Later, this data is analysed through creating a morphological chart and in the results section, the analysis done using this MC is given. This research paper then ends with a conclusion where a discussion on the limitations and further study possibilities is done.
2. Literature Review
Morphology is about the form and the shape of a product. Morphological charts are structured brainstorming tools and idea generation methods to generate and visualise many solutions at once (Jones, 1992). In order to create new forms, designers use this morphological analysis (Jawaharlal et al., 2016). There are multiple uses of the term, because by trying to create a morphological chart, the designer has the opportunity to think analytically about the possible solutions/forms, that is why it is also named as morphological analysis. Other names for morphological charts that can be encountered in the literature are as following; morphological analysis (also implicates a wider concept), shape synthesis method, morphological matrix, and checkerboard method (Hsiao and Ko, 2013). These names also show that this method is matrix based, meaning the person who applies this tool creates a matrix to help gather many ideas. In this research, the term “morphological chart” is used.
The execution of the morphological charts is explained in the literature thoroughly. According to the Delft Design Guide (2013), morphological charts are done by deconstructing the product functions into its sub-functions (Boeijen et al., 2013) and they are done in order to find out and analyse the possibilities in terms of form in a product by trying out combinations of the said product (Hsiao and Ko, 2013). These sub functions can also be parts of a product. Tjalve (1979) states that, sub-functions of a product are as important as the main function and these sub-functions determine the forms of the elements of a product while the main function determines the general form of the said product. This shows that the design divergence is accomplished with different solutions for a sub-function of the product, since the main function would not be changed for the product to serve its purpose. This explanation serves the reasoning behind finding out the sub-functions and their corresponding solutions; since they are the reasons there are many different designs for a certain structural design problem.
These charts are used mainly by design engineers, because, in order to be able to divide a problem to its sub-functions, the problem should be defined, even well- defined (Rittel and Webber, 1973) (Rittel, 1972) rather than ill-defined. Therefore, this method is not suitable to be used in the fuzzy front end of the design process. The expected outcome and the stakeholders that are involved should be defined to start the process.
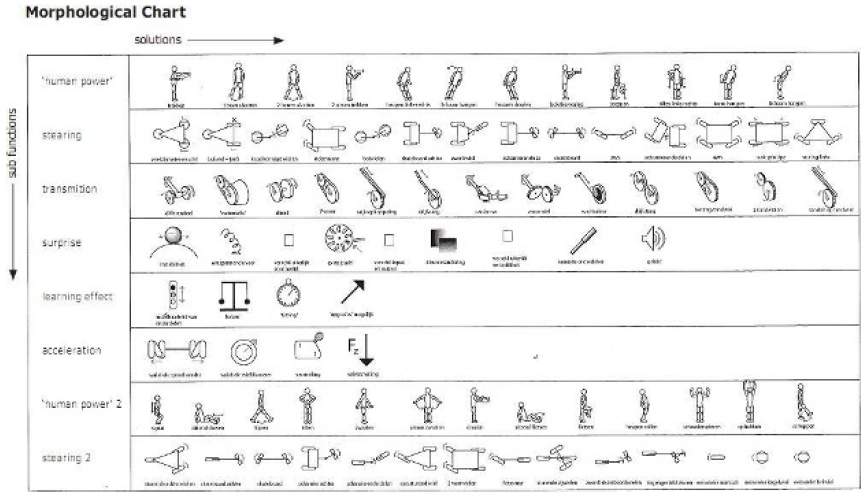
Morphological charts are not only for creating many solutions, but they are also used to help designers visualise the design space for a certain type of product, when used with images/graphics/drawings (Dym and Little, 2004). Below (Fig. 1), is an example for a morphological chart for human- powered land vehicle design from Delft Design Guide (2013).
The main reason for choosing this method over others is the easy deconstruction of the problem in the data. It is because the designs are created with a design brief given by the instructors of the course, with a well-defined problem, which is carrying 2 or more cups of drinks by hanging at one point. This problem definition itself enables us to deconstruct the products/designs to its sub-functions, since it already tells us what those sub-functions are. In human powered land vehicles, it already says that it is powered by a human, therefore, solutions for powering this vehicle by a human should be addressed whether it’s a pedal, an arm that stretches, a sway movement… In the tea tray example, hanging the tea tray would mean a handle would be needed, while carrying 2 or more drinks would require a surface to carry, or create different solutions, to which we will get to in the results section. So, to understand how to reverse this idea generation tool, morphological chart, we need to explain how to make this chart in the first place.
Steps for constructing a morphological chart for idea generation are as follows (Jones, 1992) (Dym and Little, 2004) (Hsiao and Ko, 2013) and the names used in these steps are by Tiwari et al. (2007):
Step 1: DECOMPOSITION - List the sub-functions of the product. These sub-functions can be found through function analysis and with the help of a design brief or problem statement.
Step 2: GENERATION - Find out solutions to these sub-functions. This process can involve other idea generation methods such as brainstorming.
Step 3: COMBINATION - Explore different combinations of solutions and find a combination that suits the problem statement. This step involves choosing one solution for each sub-function. This step is about concept generation (Jawaharlal, 2016)
Use of MC’s effects have been examined with scholarly work in many different fields of expertise. Morphological charts were developed by Zwicky (1967) who was an astrophysicist and MCs are also used in many engineering fields such as aeronautic engineering (Bardenhagen and Rakov, 2019), mechanical engineering (James et al., 2023) or textile engineering (Bertoluci and Sanches, 2020). The method is shown to be effective for creating many potential combinations of solutions, therefore, many variants in all these cases. Nowadays, many of this research also focus on ways to reduce the number of solutions to a quantity that is manageable. Börekçi (2018) investigated its effectiveness in terms of design divergence. Therefore, their work is on the quantity of the ideas rather than the quality. This research was done with 50 grad students. They have found out that the participants tend to create solutions to more than one sub-function at once and continue exploring solutions for sub-functions they have already moved away from; this means that for the participant, the components of a product (in this case a coffee maker) were not independent, rather interdependent. Another recent research with grad students as participants was done by Zeiler (2018) in the context of building design. They have also gathered participants from different disciplines. Each discipline’s participants created an MC, and these MCs were transformed into a main morphological chart, with the most relevant sub-solutions selected from these individual MCs. As it can be seen in this research, the morphological chart is generally used as it is intended to be used, as an idea generation tool.
After summarising how an MC is created and what it is used for, the limitations and drawbacks of this tool needs to be addressed. All methods and tools have their advantages and disadvantages and MCs are not exempt from that. With morphological charts, many different solutions can be seen at once. Each combination in a morphological chart, results in a different product. The size of the chart, therefore the matrix, determines the number of combinations. While it is an advantage, to create many products using one method, that many possibilities become a disadvantage. For example, the given morphological chart, the one above for human-powered land vehicles has 57,238,272 different combinations therefore numerically, this many different human-powered land vehicles can be derived from this morphological chart. If exhausting all the combinations leading to a “good” design could be possible, then this could have been done easily by a computer program. This should not mean to exclude the whole literature on parametric design and modelling but choosing the suitable combination of solutions requires serious expertise. Even with this expertise, it may take a lot of time to explore the different possibilities.
In addition to this, it is known that designers have had difficulties identifying the sub-functions in the first place. While this method eliminates the risk of missing novel solutions with the many combinations, the overwhelming number of possible combinations makes it impossible to scan all combinations, therefore, the number of sub-functions should be limited. This limitation should not be done without considering every part of the product; they should be enough to construct the product via a morphological chart (Bardenhagen and Rakov, 2019) (Jones, 1992). This example given in Delft Design Guide (2013) was an example of a product with power, mechanical parts, moveable parts etc. In this research, the data that is used in MC does not have many of these, it is rather a structural project, which is mainly static. However, we have observed the diversity in the solutions; and this also led us to use the MC method for analysis, since these matrices can deal with many different designs/solutions at a smaller scale. We do not need to show every different tea tray design as it is, we deconstructed all these tea trays to their sub-functions, found each one’s sub-solutions, and transferred this information into a matrix which is a morphological chart. Now, we can see, investigate, and analyse these designs with a matrix which is way more manageable than 300+ design presentation boards.
3. Methodology
As mentioned in the earlier sections, the main motivation behind this study relies on the observations and results of a structural design project given to a hybrid group of students studying different design disciplines at undergraduate level. The design project was conducted in Istanbul Technical University, Faculty of Architecture. There are five departments in this faculty. These departments are Architecture, Industrial Design, Interior Architecture, Landscape Architecture, and Urban and Regional Planning. Students from these departments enrol to the common set of courses for foundation studios in their first 3 semesters of undergraduate education. Students from these five different departments were given a one-day project called “Tea Tray Revisited” which was initiated by the industrial design department as part of a series of projects led by different departments in the spring semester of the 2016- 2017 academic year. Data used in this research are the design presentation boards of the students which include photographs and/or drawings of their designs. They also presented their own cardboard models of tea trays, however, not every one of these models have been archived while all the boards are available for analysis.
3. 1. Design Brief
The design brief, requiring the redesign of the traditional tea tray, involved the processes often used by industrial designers to design products. The same design brief was given to all students, from all 5 departments, to teach them the basics of industrial design; how to approach an industrial design problem and understand the connections between the user, environment, function, and structure. This brief involved the common questions industrial designers answer such as who will use this product, how will it be used, and also selection of the material, ergonomics of the product etc. It was a one-day exercise and at the end of the day, students presented their designs with a design presentation board and a model of their tray out of cardboard.
In order to start designing their own trays, students needed to create a user scenario first. They formed mixed groups, students from different design departments working together. Each group included 3-4 students and each group created a user scenario, which is one of the requirements in the design brief, by using the 5W1H scenario building method. This scenario enabled students to come up with decisions like the place of use of the tray, whether it is a cafe, an office, or a ferry; how many cups are needed to be served at once, etc., creating a background for the use of the tray. Using the same scenario, students in the group designed their own individual trays. Therefore, this design activity resulted in 300+ different trays, resulting in the same number of trays with the same number of students.
3. 2. Design Presentation Boards
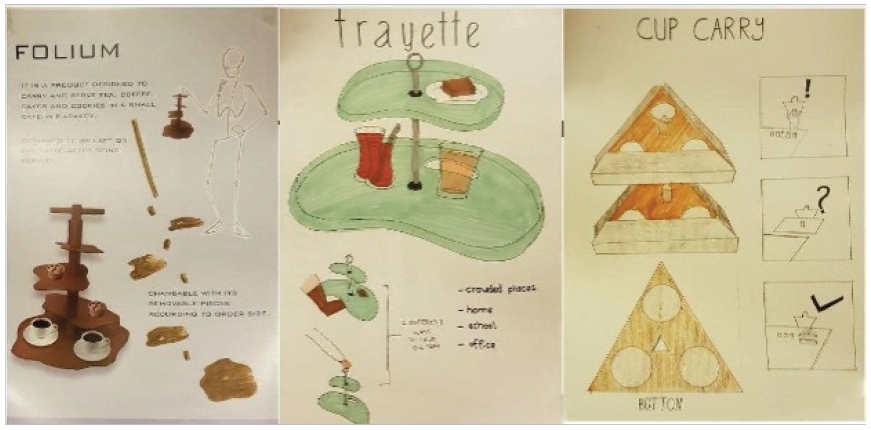
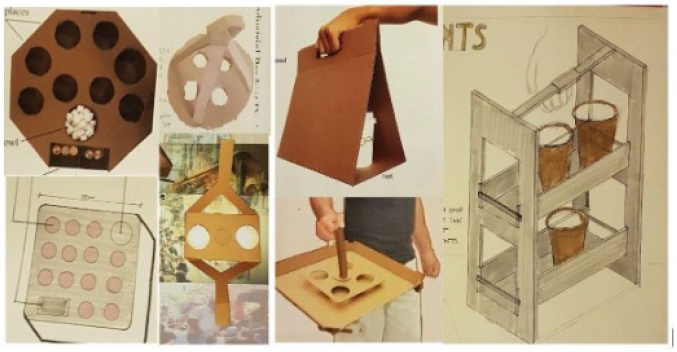
Data used in this research is obtained through the design presentation boards of the students. Students designed these boards to express and explain their designs. Here are some examples of these design presentation boards (Fig.2). Some of the boards have drawings of the design while some have a photograph of the cardboard model.
As the brief requires the design of a tray that can hold more than one cup of hot beverages to be served; to be held by one hand and to be carried by hanging. Therefore, while some of the sub-functions of the product are defined, some others are to be defined by the student, through their scenarios.
3. 3. Data Classification and Analysis
To analyse these design presentation boards according to a morphological chart logic, the following steps are executed.
Step 1: Design presentation boards are numbered and photographed for each student.
Step 2: A list of sub-functions that the students generated are defined by scanning through all the design presentation boards, involving both the visuals and the textual explanations.
This formed the vertical axis of the morphological chart.
Step 3: All design presentation boards were investigated and each different solution to a sub-function is added to the morphological chart. This formed the horizontal axis of the morphological chart.
In the end it was possible to build a morphological chart in an Excel document that consists of all the defined sub-functions and their corresponding solutions created by students.
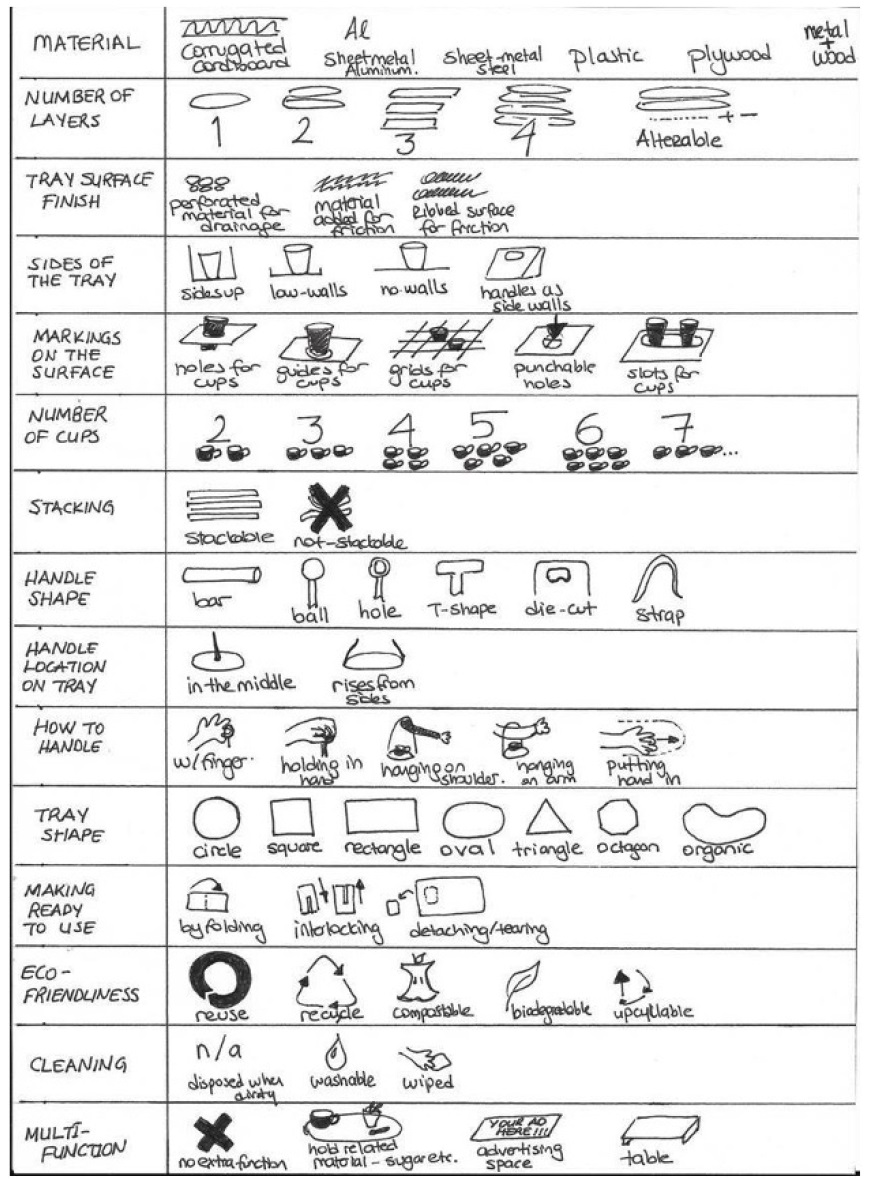
After these steps, the following morphological chart is constructed (Fig. 3).
3. 4. Results
All the sub-functions defined by all students are as follows. It is interesting to note that none of these sub-functions are defined in the design brief. These sets of sub-functions are the creation of this set of students at that specific time the study was conducted.
Defined sub-functions by students:
- • Material of the tray
- • Number of layers of the tray
- • Tray surface finish
- • Sides of the tray, whether they are down, up like a wall of halfway
- • Markings on the surface, to keep cups in place
- • Number of cups the tray can carry
- • Stacking
- • Handle shape of the tray
- • Handle location of the tray
- • How to handle the tray
- • Tray shape
- • Making the tray ready to use
- • Eco-friendliness of the tray
- • Cleaning options of the tray
- • Multi-functionality of the tray
Solutions corresponding to these sub-functions have been noted down looking at 345 design presentation boards done by students. All different solutions have been added to the morphological chart, whether it is done by one student only or have been implemented in many students’ designs.
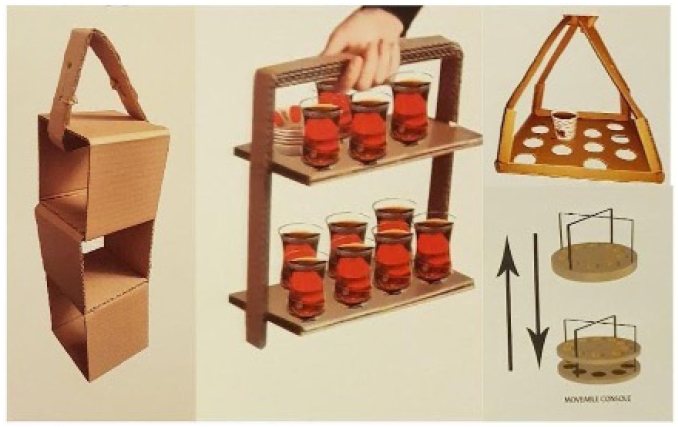
Number of layers (Fig. 4) of the tray is about the number of cup-carrying surfaces. It can be a single layered tray just like a traditional tea tray or it can be multi-layered. There are trays which have an alterable number of layers; these trays can be expanded by the means of levels or layers if there is a need for more cup carrying capacity. Number of layers in this study are 1, 2, 3, 4 and alterable. Below are some examples for different types of trays in terms of number of layers. The one on the left shows a 3-layered-tray, middle shows a 2-layered-tray and on left, an alterable number of layers in a tray can be seen.
Trays designed by students had a limit of carrying 2 cups as a minimum in the design brief. Therefore, these trays carry 2 or more cups. In this study, the number of cups for designed trays are as follows: 2, 3, 4, 5 and more than 5 cups. At the end of this paragraph are examples of trays with different carrying capacities. Handle type is a creative categorical variable in this study. Many students created different handles for their trays. Some of these handle types are related and restricted by the material for the tray, such as sheet materials having die-cut handles. However, not all trays with sheet material have die-cut handles. Handle type solutions in this research are bar, ball, hole, T-shape, die-cut, and strap handles. Below are some examples for handle types (Fig. 5). In this figure, examples for hexagonal, square, and rectangular trays are given. Also, die-cut handle, ball handle, and bar handle can be seen in these representation of tray designs.
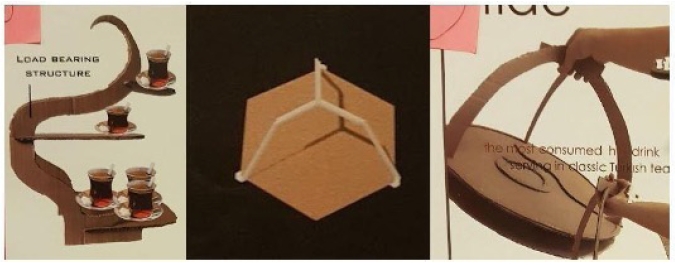
Tray shape is the last of the examples of sub-functions that will be explained in this text. By tray shape, the shape of the cup-carrying-surface is meant. There are many different tray shapes designed by the students in this study. These solutions in this study are as follows, circle, square, rectangle, triangle, oval, octagonal, hexagonal, and organic shaped. Below are some examples of different tray shapes from the study (Fig. 6).
Material selection of the tray was a problematic sub-function in this study. Corrugated cardboard is given as the model material in the design brief. Therefore, some students did feel obligated to make a structure only by using that material, not using it for model purposes only. It resulted in many students choosing corrugated cardboard as the main material of their trays. Another problem was that some students did not mention which material they chose for their tray designs. This resulted in not available data for these designs. However, with the given information in the design presentation boards, solutions for the material are corrugated cardboard, sheet metal (aluminium and steel), plastic, plywood and wood and metal combination.
Students added a texture to their designs in order to add friction to the tray surface. This either results in additional material for friction or a pattern added with a process in manufacturing to the surface. Another reason for tray surface finish is the problem of spilled drinks. Perforated material for drainage is designed as a solution by some students. And of course, many students designed a plain surfaced tray. Sides of the tray are other features designed for keeping the cups, plates etc. on the tray. Trays that are used at home for serving food and drinks usually have higher walls than the trays used by professionals. These walls also help keep the liquids inside the tray in case of a spill if the walls are all around the tray. In this study, students designed 3 different solutions for the sides of the tray. These solutions are as follows: trays with no walls on sides, such as professional serving trays or traditional tea trays; trays with low or middle walls, and trays with walls that go all the way up, positioning the cups inside of the walls. Cups on a tray can slide away while moving. To eliminate that danger, students came up with markings on the tray. These can either be holes, guides, grids, or slots. There can also be pressable holes, which are markings of holes that can be opened by removing or pressing on that material. There are also plain surfaced trays without any cut-outs.
Students designed trays that are stackable and not stackable. That was also added to the morphological chart since it was mentioned as a feature by some students.
Handle shape was not the only sub-function related to the handle of the tray. Handling type or how to handle, and location of the handle on the tray are also sub-functions of the tray. Handle rises either from the middle of the tray, or the sides of the tray. These designed trays are handled with following handling types: holding in hand, with finger, hanging on shoulder or on arm or by putting hand inside the tray.
Some students designed trays that are not ready to use therefore needs assembly by the user. This can be made by folding, interlocking, or detaching/tearing. Again, some of the students also mentioned the ecological features of their designed trays. These features are reusable, recyclable, compostable/biodegradable and up cyclable (it can be turned into something better, more valuable). The recyclable and biodegradable trays are disposed when dirty (also the disposable trays without these features), and reusable trays can be either washable or wipeable. Therefore, cleaning is also added to the morphological chart as a sub-function with these solutions.
Lastly, some students designed multi-functional trays that have more than one function. This function can be holding related material such as sugar, plates, spoons etc. This is also a tray function however since the design brief given is for cup carrying only, this is also added as an added function. Other added functions in the students’ trays were using the tray as an advertising space and using the tray as a table.
4. Conclusion
This study was conducted in order to experiment the possibility of using morphological charts, which is an idea creation method, to analyse existing designs. To do so, data from a study in Istanbul Technical University was used as design input. With this research, steps of creating a morphological chart for analysis is given. These steps have been executed with the design data from the study. It shows that using morphological charts for analysing existing designs is possible and can lead to further research. Further studies can include investigating the effectiveness of this use of the method with comparison to other analysis methods and using this method for analysing products in the market.
Morphological charts are idea generation methods, as mentioned earlier. To reverse this idea generation method and make it into an analysis method, a different set of steps is needed.
Steps for using morphological chart as an analysis method are as follows:
Step 1: COLLECT EXISTING PRODUCTS - Different products that belong to the same product type are collected. This can be done with a simple market research that involves the images of the product (either a drawing, a model, or a photograph).
Step 2: MAKE A LIST OF SUB-FUNCTIONS - You take each product, analyse it, and dissect it to its sub functions. At the end of this step, you will have a set of sub functions formed according to the products you have accumulated at the first step. When you reach the maximum number of sub functions you can continue to add your solutions to your matrix. It is possible to encounter other sub functions with a larger collection of products, a larger design space. It is important to look at as many products as possible to contain the greatest number of sub-functions.
Step 3: PLACE EXISTING PRODUCTS - Visually place each product’s solutions according to the sub-functions to the matrix. Add if there are additional sub-functions and their corresponding solutions.
5. Discussion
The morphological charts created with analysing existing designs, as done in this research, can provide data input for 3D shape synthesis methods and models such as Lang and Sun’s (2020) network or Xie et al. (2020)’s VoxelNet by converting design data or Hsiao and Huang (2002) has used morphological charts as input to neural networks.
Morphological charts, created with existing products can help designers understand and visualise a design space, help them benchmark, and these charts can help designers express design related situations to non-designers. With these simplified steps for doing so, even non-experienced professionals can create these morphological charts and use these charts as they wish, visualisation, analysis, benchmarking, presentation, data etc.
We believe that it is possible to analyse products that belong in the same type, in the market, using a morphological chart as an analysis method. Take a coffee cup as an example for this use, with deconstructing the existing cups to their sub-functions or by naming a coffee cup’s sub-functions a similar list to this research’s sub-function list can be made. When a morphological chart is constructed by placing the sub-functions from this list of sub-functions to the vertical axis of the chart and adding the corresponding solutions to these sub-functions and placing them to the corresponding lines, in the horizontal axis, a collection of combinations of solutions is acquired. This collection of combinations also shows a collection of possible products. Using this collection of combinations, possible innovations, optimisation, and solutions to current problems in that type of product can be identified. Therefore, a morphological chart created using existing designs will provide the designer the analytical infrastructure to start a new design.
6. Limitations of the study
This study uses data obtained in Istanbul Technical University and from an unrepeatable foundation/basic design course syllabus. Since then, the syllabus of that course has changes, therefor it would be impossible to repeat this study with students in similar backgrounds.
The preferences and percentages of the solutions within these students’ designs were not included in this study. This paper focuses only on the method creation/alteration in design research field, which concludes with the explanation of this new method’s use, step-by-step.
Acknowledgments
Funding: This research did not receive any specific grant from funding agencies in the public, commercial, or not-for-profit sectors.
Notes
Copyright : This is an Open Access article distributed under the terms of the Creative Commons Attribution Non-Commercial License (http://creativecommons.org/licenses/by-nc/3.0/), which permits unrestricted educational and non-commercial use, provided the original work is properly cited.
References
-
Bardenhagen, A., & Rakov, D. (2019). Advanced morphological approach in Aerospace design during conceptual stage. Facta Universitatis, Series: Mechanical Engineering, 17(3), 321-332.
[https://doi.org/10.22190/FUME180110005B]

-
Bayırlı, M., & Börekçi, N. A. (2022). Correlation between idea generation effort and resulting design solution success: An empirical study using RNEV as a new assessment technique. Thinking Skills and Creativity, 44, 101036. https://doi.org/10.1016/j.tsc.2022.101036.
[https://doi.org/10.1016/j.tsc.2022.101036]

-
Bertoluci, C. E., & Sanches, R. A. (2020). Using a morphological chart to develop fashion products from recycled knit waste. ModaPalavra eperiódico, 13(27), 108-137. http://dx.doi.org/10.5965/1982615x13272020108.
[https://doi.org/10.5965/1982615x13272019108]

- Boeijen, V. A., Daalhuizen, J., Zijlstra, J., & Roos, V. der S. (2013). Delft design guide. Bis Publishers.
- Börekçi, N. A. (2018). Design Divergence Using the Morphological Chart. Design and Technology Education, 23(3), 62-87.
- Dym, C. L., & Little, P. (2004). Engineering design: a project -based introduction. John Wiley & Sons.
-
Hsiao, S.-W., & Huang, H. C. (2002). A neural network based approach for product form design. Design Studies, 23(1), 67-84. https://doi.org/10.1016/s0142-694x(01)00015-1.
[https://doi.org/10.1016/S0142-694X(01)00015-1]

-
Hsiao, S.-W., & Ko, Y.-C. (2013). A study on bicycle appearance preference by using FCE and Fahp. International Journal of Industrial Ergonomics, 43(4), 264-273. https://doi.org/10.1016/j.ergon.2013.04.003.
[https://doi.org/10.1016/j.ergon.2013.04.003]

-
Jamea, A., Jing, L., Peng, X., Li, J., & Jiang, S. (2023, January 2). Whist Game Cards Calibration Strategies-Based Technique for Conceptual Design Morphological Chart Refinement. Designs, 7(1), 4. https://doi.org/10.3390/designs7010004.
[https://doi.org/10.3390/designs7010004]

-
Jawaharlal, M., Ellingwood, S. N., & Thokchom, K. (2016). Life centered design using Morphological Chart. Volume 11: Systems, Design, and Complexity. https://doi.org/10.1115/imece2016-65121.
[https://doi.org/10.1115/IMECE2016-65121]

- Jones, J. C. (1992). Design methods. John Wiley & Sons.
-
Lang, X., & Sun, Z. (2020, May). Structure-aware shape correspondence network for 3D shape synthesis. Computer Aided Geometric Design, 79, 101857. https://doi.org/10.1016/j.cagd.2020.101857.
[https://doi.org/10.1016/j.cagd.2020.101857]

- Rittel, H. W. (1977). On the Planning Crisis: Systems Analysis of the "first and Second Generations". Stuttgart, Germany: Institut für Grundlagen der Planung IA, Universität Stuttgart.
-
Rittel, H. W. J., & Webber, M. M. (1973). Dilemmas in a general theory of planning. Policy Sciences, 4, 155-169.
[https://doi.org/10.1007/BF01405730]

-
Tiwari, S., Summers, J., & Fadel, G. (2007, January). A genetic algorithm based procedure for extracting optimal solutions from a morphological chart. In International Design Engineering Technical Conferences and Computers and Information in Engineering Conference (Vol. 48078, pp. 29-38).
[https://doi.org/10.1115/DETC2007-35497]

- Tjalve, E. (1979). A Short Course in Industrial Design. Newnes.
-
Xie, J., Zheng, Z., Gao, R., Wang, W., Zhu, S. C., & Wu, Y. N. (2020). Generative VoxelNet: learning energy-based models for 3D shape synthesis and analysis. IEEE Transactions on Pattern Analysis and Machine Intelligence, 44(5), 2468-2484. https://doi.org/10.1109/tpami.2020.3045010.
[https://doi.org/10.1109/TPAMI.2020.3045010]

-
Zeiler, W. (2018, January). Morphology in conceptual building design. Technological Forecasting and Social Change, 126, 102-115. https://doi.org/10.1016/j.techfore.2017.06.012.
[https://doi.org/10.1016/j.techfore.2017.06.012]

-
Zwicky, F. (1967). The Morphological Approach to Discovery, Invention, Research and Construction. In: Zwicky, F., Wilson, A.G. (eds) New Methods of Thought and Procedure. Springer, Berlin, Heidelberg. https://doi.org/10.1007/978-3-642-87617-2_14.
[https://doi.org/10.1007/978-3-642-87617-2_14]

