Crossmodal Correspondences Between Brand Name and Typeface in Brand Communication
Abstract
Background The sound of brand names conveys images as does the visual form of typefaces. Designers and brand managers consider these images when developing brand identities, but their efforts have largely relied on intuition, experience, and market trends. To this end, the present study empirically investigates the conjoint influence of the images conveyed by the brand name and by the typeface in brand identity.
Methods Study stimuli were developed as brand logotypes based on the results of pretests to manipulate the images conveyed by hypothetical brand names and typefaces. Chi-square tests and PROCESS macro regression analyses were conducted on survey data of 268 individuals to reveal how the interplay between brand name image and typeface image influences brand memory and consumer attitudes.
Results Aligning, as opposed to contrasting, the images of brand name and typeface in brand logotypes yields higher brand memory and consumer attitudes. However, what overrides this general tendency is that embedding small, feminine, light (vs. dark), soft, or light (vs. heavy) images in brand name most significantly contributes to increased brand memory and consumers’ affective and global attitudes, whereas embedding large, masculine, dark, hard, or heavy images in typeface most significantly contributes to increased consumers’ cognitive attitude.
Conclusions This study objectively analyzes how brands can capitalize on the intuitive sensations evoked by visual and textual information in their visual identity for effective brand communication. Detailed findings of the study provide guidelines for stakeholders and designers in developing brand names and visualizing them into logotypes with respect to the strategic focus of their brand.
Keywords:
Brand name, Crossmodal Correspondence, Logotype, Sound Symbolism, Typeface1. Introduction
As today’s society is sometimes referred to as an “attention economy,” the bombardment of communication content far exceeds the cognitive capacity of consumers, who are thus forced to allocate attention selectively. In turn, the competition among brands for the scarce resource is growing in intensity and effective brand communication has become a necessity. Moreover, in today’s global economy, how brand communication efforts are perceived and interpreted across languages and cultures is an important managerial concern. The two core elements of brand identity that define the initial impression of a brand are its brand name and the visual form in which the brand name is presented to consumers. Brand name, in particular, is critical not only because no business entity can operate without a name and it shapes the initial brand image (Aaker, 1991), but also because it is difficult to change once established. Hence, strategically managing the intuitive feelings consumers experience from brand names provides an advantage for brands.
A growing body of research supports the notion that there exist nonarbitrary mappings between sound and meaning. These associative mappings are collectively referred to as sound symbolism (e.g., Newman, 1933; Sapir, 1929). Perhaps the most well-known paradigm is the bouba-kiki effect, which refers to people’s tendency to associate bouba with a round shape and kiki with a spiky shape (Ramachandran & Hubbard, 2001). In the context of brand communication, sound-meaning associations offer invaluable benefits to brands in ensuring that brand names convey images that are universally shared (e.g., Cai and Zhao, 2019; Chen et al., 2016; Hoshi et al., 2019; Huang et al., 1969; Miron, 1961; O’Boyle et al., 1987; Shrum et al., 2012). However, little is known as to how brand names interact with the visual form in which they are presented at brand-consumer touchpoints. Considering the low likelihood that consumers experience brand names purely acoustically during the entire consumption process, the influence of brand names must be considered conjointly with the visual form in which consumers experience them. Moreover, there exists a literature gap between the research strand of sound symbolism in brand naming and that of visual communication in brand design. To this end, the present study empirically investigated how the images conveyed by brand names interact with the images conveyed by typefaces to ultimately shape consumers’ perception and attitude.
2. Literature review
2. 1. Brand name image
Brand names often serve as the first point of interaction between brands and consumers, and the expectation toward an unfamiliar brand is said to almost entirely derive from the initial impression created by the brand name (Aaker, 1991). Studies have demonstrated that brand names that are relevant to the product category or suggestive of a positive product attribute increase brand preference (Bao et al., 2008; Hillenbrand et al., 2013; Kohli et al., 2005; Lowrey & Shrum, 2007). Brands were also evaluated higher on product attributes that are semantically associated with the brand name (Wänke et al., 2007). Brand names also significantly influence consumers’ retention such that those connoting product attributes or benefits (Lowrey et al., 2003) are better remembered. Hence, desirable brand names are perhaps those that are memorable (Delano, 1999) and evoke meaningful associations (Kapferer, 2012). It is also important for brand names to be registrable and interpreted consistently by global consumers. Here, sound symbolism offers a means to embed sensorially transferable meanings in brand names that are universally shared. A myriad of results testifies that such sound-meaning associations are governed by some generalizable patterns, in which certain acoustic features facilitate certain image associations in word perception (see Westbury et al., 2018, for a review.) Studies have shown that brand names whose sound symbolism is consistent with the brand are more preferred and better remembered (Boltz et al., 2016; Choi et al., 2018; Klink, 2001; Lowrey & Shrum, 2007; Shrum et al., 2012; Vanden Bergh et al., 1984; Wu et al., 2013; Yorkston & De Mello, 2005).
One approach in measuring the sound symbolic image of sounds is by sonority, which refers to the loudness of a sound relative to that of other sounds with the same length, stress, and pitch (Ladefoged & Johnson, 2011). According to sonority hierarchy (Table 1), vowels are most sonorous, among which the height of vowels is inversely proportional to its sonority, and approximants are less sonorous than vowels but more sonorous than nasals, which are more sonorous than obstruents (Carr, 1993; Goldsmith, 1990; Gussenhoven & Jacobs, 2017; Jesperson, 1904; Katamba, 1989; Ladefoged & Johnson, 2011; Selkirk, 1982). In the present study, we manipulate brand name image using sonority hierarchy as recent attempts associating sonority with sound perception have shown plausible evidence (Jacobs & Kinder, 2018; Johansson et al., 2020) and sonority describes a more rudimentary nature of sounds than do articulatory phonetics. Previous studies have associated high sonority sounds with the images of smallness, lightness (vs. darkness), and lightness (vs. heaviness) and low sonority sounds with the images of largeness, darkness and heaviness (Cuskley et al., 2019; Newman, 1933; Walker & Parameswaran, 2019). Drawing on previous studies and considering the polarized images associated with sound symbolism, we hypothesize that brand names differ in their influence on brand memory and consumer attitudes depending on the images they convey, for which we comparatively analyze brand names with high sonority sounds against brand names with low sonority sounds.

Sonority hierarchy (higher row implies higher sonority)
2. 2. Typeface image
The denotative content of text is verbal language while the connotative meaning of text—the visual structure in which the text is written—is a form of visual language. Typefaces carry a communication capacity such that the visual features of a text interact with the denotative meaning of the message to significantly affect the delivery and impact of the message (Doyle & Bottomley, 2009; Tannenbaum et al., 1964). Prior research support that readers agree on the appropriateness of typefaces for different contexts and uses (Haskins, 1958; Schiller, 1935) and consistently ascribe certain personality or attribute to particular typefaces (Brumberger, 2003; Nedeljković et al., 2017; Velasco, Woods, et al., 2018). The reason as to why typefaces differ in their connotative meaning is essentially in the visual structures carrying a certain atmosphere in themselves.
Both practitioners and scholars have regarded typeface as an important component to achieve brand communication goals (Childers & Jass, 2002; Henderson et al., 2004; McCarthy & Mothersbaugh, 2002; Pan & Schmitt, 1996; Tantillo et al., 1995). Previous studies have found that typeface influences the memorability and readability of advertisements and ultimately brand perceptions (Childers & Jass, 2002; Hagtvedt, 2011; Henderson et al., 2004; Lieven et al., 2015; McCarthy & Mothersbaugh, 2002; Xu et al., 2017) such as brand identity (Doyle & Bottomley, 2004; Zaichkowsky, 2010) and brand personality (Grohmann et al., 2013). Moreover, researchers have explored not only the independent role of typeface but also its interactive effect with other pertinent factors. For instance, previous studies identified the importance of the fit between typeface and product category (Doyle & Bottomley, 2004), between typeface and brand symbol (Salgado-Montejo et al., 2014), and between typeface and target gender (Wen & Lurie, 2018). Research have also found that appropriate typefaces in brand identities can form the personality of the brand (Grohmann et al., 2013; Jordan et al., 2017), communicate brand positioning and product attributes (Celhay et al., 2015; Doyle & Bottomley, 2011; Velasco, Hyndman, et al., 2018), reinforce behavioral intention (H. Huang & Liu, 2020), increase the likelihood to recommend (Grohmann, 2016), and ultimately build its market share (Doyle & Bottomley, 2004). Drawing on these arguments and considering the polarized images associated with typefaces from prior literature (Table 2), we hypothesize that typefaces differ in their influence on brand memory and consumer attitudes depending on the images they convey, for which we comparatively analyze serifed, lowercased, oblique, thin, and non-extended typefaces against sans-serifed, uppercased, roman, bold, and extended typefaces.
Previous findings on typographic image
2. 3. Crossmodal correspondences
Cognitive psychology has long recognized that information received through multisensory organs and perceived as congruent or consistent yield responses different that those perceived as incongruent or inconsistent. This is commonly explained by the theory of processing fluency such that the consequences result from a sense of familiarity, arising from limited cognitive processing (Whittlesea, 1993). Empirical findings have revealed that subjects display faster response times under multisensory congruent conditions than under incongruent conditions of sound-size associations (Itagaki et al., 2019), sound-shape associations (Heyman et al., 2019; Hung et al., 2017), sound-typeface associations (Lewis & Walker, 1989), sound-color associations (Sun et al., 2018), shape-typeface associations (De Carolis et al., 2018), and shape-word associations (Velasco et al., 2016). Regarding brand memory, unfamiliar words whose definition aligns with the sound symbolic image of the word are better remembered than their alternatives (Preziosi & Coane, 2017). In the context of branding, memorability was found to enhance as the degree of consistency among advertising elements increased (Childers & Jass, 2002; S. Y. Lee & Shen, 2009). Regarding attitudinal responses, conceptual or perceptual fluency leading to positive attitudes have been observed (e.g., Lee & Labroo, 2004; Reber et al., 1998; Winkielman & Cacioppo, 2001).
Consistent cues across various media have also been shown to yield desirable consumer attitudes. Congruencies between typeface and product category and between typeface and product shape were found to increase brand choice and brand value (Van Rompay & Pruyn, 2011). Consistency in design elements was also found to increase brand preference and affective responses (Lieven et al., 2015; Pleyers, 2021). From the perspective of multisensory brand communication, scent was found to be effective in increasing brand favorability when the scent is perceptually congruent with the brand image (Errajaa et al., 2021), while music was found to be effective in increasing brand choice when the music is perceptually congruent with the product category (North et al., 2016). More specifically related to the present study, Doyle and Bottomley (2004, 2006, 2011) have demonstrated that congruent brand name and typeface combinations lead to higher brand preference and evaluation. However, a more constructive approach is called for to integrally analyze consumers’ response to auditory and visual branding cues by incorporating objective, fundamental measures of sounds and typeface, developed in linguistics and design, respectively. Such an approach would lead to empirical evidence that reduces the uncertainty involved in the decision-making process of branding. In this light, the author’s pilot study revealed that image-congruent combinations of brand name and typeface positively impact brand memory, brand appeal, and perceived quality (Jun & Lee, 2022). The present study further explored in depth the effect of the alignment between the images conveyed by brand name and typeface when consumers encounter logotypes of unfamiliar brands.
3. Method
3. 1. Materials
Two pretests were conducted to establish image manipulations: Pretest 1 (resp., Pretest 2) collected the extent to which hypothetical brand names (resp., typefaces) convey certain images. A list of semantic differentials was compiled from prior literature on sound symbolism and the work by Osgood, Suci, & Tannenbaum (1957), from which ten pairs were selected based on two criteria: (1) any pair of images that is dominantly specific to either brand names or typefaces were excluded, and (2) any pair of images whose either pole describes a negative attribute was excluded. The selected image dimensions were small vs. large, feminine vs. masculine, light vs. dark, fast vs. slow, soft vs. hard, light vs. heavy, weak vs. strong, passive vs. active, cold vs. hot, and humorous vs. serious. The two poles of these image dimensions are designated as Pole 1 (left of vs.) and Pole 2 (right of vs.) for brevity.
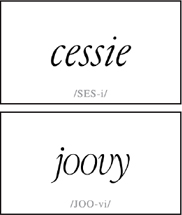
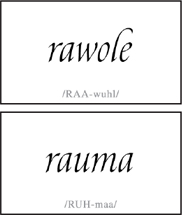
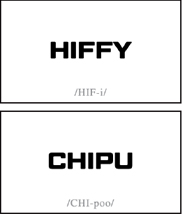
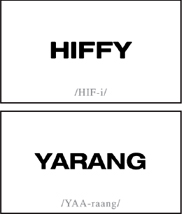
Sixteen candidates of hypothetical brand names were developed for Pretest 1: Cessie, Hiffy, Bougo, Dobou, Joovy, Thitto, Keshu, and Chipu are concentrated with low sonority sounds and thus belong to Pole 1, and Rauma, Yarang, Maula, Walong, Maraun, Rawole, Nawone, and Laumal are concentrated with high sonority sounds and thus belong to Pole 2. These disyllabic non-words were carefully fabricated such that they are not suggestive of any existing brand and were reviewed by a professor in English Phonetics and Phonology for suitability and viability. A total of 56 individuals participated in Pretest 1, who rated each brand name on the ten image dimensions.
Typeface image manipulation involved five criteria of classification, letter case, posture, weight, and width. Sixteen typefaces were selected to be tested: Adobe Caslon Pro Italic, Baskerville MT Std Italic, CantoPen Light Italic, Centennial LT 46 Light Italic, Didot LT Italic, Garamond Premier Pro Light Italic, IvyPresto Thin Italic, and Palatino LT Light Italic for Pole 1, and Amplitude Wide Bold, Brother XL Heavy, Eurostile Extended Black, Fedra Sans Bold, Futura Bold, Geom Graphic Bold, Helvetica Neue 73 Bold Extended, and Obvia Expanded Black for Pole 2. These were selected for their clear representation of each typographic characteristic and their level of discrimination against their alternatives. All typefaces were prepared as an identical dummy text that read, “lorem ipsum dolor,” and were reviewed by a professor in Design for suitability and viability. A total of 59 individuals participated in Pretest 2, who rated each typeface on the ten image dimensions.
Mean rating results of the two pretests are provided in Figure 1. One-way ANOVA was conducted on the pretest results to determine the dimensions that sufficiently distinguish both brand name and typeface images. Accordingly, those with a significant p-value and an effect size η2 greater than 0.1 for both brand name and typeface images were selected (Table 3), resulting in five dimensions of small vs. large, feminine vs. masculine, light vs. dark, soft vs. hard, and light vs. heavy. Then, for the reduced dimensions, the distance between each brand name image rating against each typeface image rating was calculated using the Euclidean distance formula. That is, the lower the value, the greater the congruence between the image of the brand name and the image of the typeface. Four combinations of brand name and typeface with the lowest values were selected as stimuli for the congruent condition and four combinations with the highest values were selected as stimuli for the incongruent condition (Table 4).

(left) Result of Pretest 1; (right) Result of Pretest 2
Image dimension reduction analysis
Study stimuli
Regarding terminology throughout this paper, the following variables are defined as follows: ‘logotype image congruency’ refers to whether the brand name and the typeface convey congruent or incongruent images; ‘logotype image’ refers to whether the brand name and the typeface both convey Pole 1 or Pole 2 images for the congruent condition; and ‘brand name image’ and ‘typeface image’ refer to whether the brand name or the typeface, respectively, conveys Pole 1 or Pole 2 images.
3. 2. Study
The survey comprised four parts. The first part pertained to consumer attitudes. Study stimuli were presented one at a time in a random order, which participants rated on sevenpoint Likert scales. Visual presentation not only reduces bias, but also is a feasible method as prior literature supports that sound symbolism is manifested even when words are presented visually and read silently (Aryani & Jacobs, 2018; Klink, 2000; Ohtake & Haryu, 2013). Three scales pertained to global attitude (bad vs. good, dislike vs. like, and unfavorable vs. favorable; adopted from Batra and Ahtola, 1991, MacKenzie et al., 1986, and Mitchell and Olson, 1981), three scales pertained to affective attitude (unappealing vs. appealing, unattractive vs. attractive, and hateful vs. lovable; adopted from Baker and Churchill, 1977, and Crites et al., 1994), three scales pertained to cognitive attitude (useless vs. useful, harmful vs. beneficial, and low quality vs. high quality; adopted from Crites et al., 1994, and Low and Lamb, 2000), and five scales pertained to the image of the stimuli (corresponding to the five image dimensions). The second and third parts of the survey collected participants’ demographic information and self-assessment of self-image, respectively. The fourth part measured brand memory by cued recall tasks, for which the first letter of each stimulus was presented in the same font as their originally presented form, followed by underscores whose number corresponds to the number of the remaining letters. A total of 270 participants were recruited from various regional, academic, and interest groups on online social media platforms of Facebook and LinkedIn (Table 5) by posting calls for participants which directed to the survey URL. Two of the participants were later removed from analyses for insufficient English proficiency. Cronbach’s alphas were calculated to validate the reliability of study variables (Table 6). In particular, the item of hateful vs. lovable was removed to improve the reliability of the affective attitude measure.
Demographics
Reliability of study variables
4. Result
4. 1. On brand memory
Brand memory data was recoded into two cases of no memory and partial to perfect memory. A chi-square test revealed that logotype image congruency statistically correlates with brand memory (Χ2=6.3533, df=1, p<.05, Table 7) such that consumers better remember logotypes whose brand name and typeface images agree (28.1%) than those whose images disagree (23.3%). A statistical significance was also found between brand name image and brand memory (Χ2=55.6944, df=1, p<.001, Table 8) such that consumers better remember logotypes whose brand name images belong to Pole 1 (32.7%) as opposed to Pole 2 (18.7%). Logotype image was also found to statistically correlate with brand memory (Χ2=16.0797, df=1, p<.001, Table 9) such that consumers better remember logotypes whose brand name and typeface images both belong to Pole 1 (33.6%) as opposed to Pole 2 (22.6%).
Crosstabulation on brand memory by logotype image congruency
Crosstabulation on brand memory by brand name image
Crosstabulation on memory by logotype image
4. 2. On consumer attitudes
PROCESS macro model 6 was employed (Hayes, 2022) with 5,000 bootstrapped resamples at 95% confidence interval to analyze the effects of logotype image congruency, logotype image, brand name image, and typeface image on consumers’ affective, cognitive, and global attitudes. All continuous dependent variables were mean-centered. A serial multiple mediation regression model was employed specifically to analyze and deduce which and how specific domains of consumer attitudes are impacted by the interactive influence of brand name and typeface images.
Logotype image congruency was found to significantly influence affective attitude (β=-.2015, p<.001) but not cognitive nor global attitudes. Affective attitude was found to positively influence cognitive attitude (β=.5145, p<.001) and global attitude (β=.6687, p<.001), and cognitive attitude was found to positively influence global attitude (β =.2952, p<.001). Affective and cognitive attitudes were found to fully mediate the relation between logotype image congruency and global attitude (Figure 2; Table 10).

Serial mediation analysis on logotype image congruency
Serial multiple mediating effects of affective and cognitive attitudes on the relation between logotype image congruency and global attitude
Logotype image was found to significantly influence affective (β=-.3526, p<.001) and cognitive (β=.2456, p<.001) attitudes, but not global attitude. Affective attitude was found to positively influence cognitive (β=.4865, p<.001) and global (β=.6291, p<.001) attitudes, and cognitive attitude was found to positively influence global attitude (β=.3202, p<.001). Affective and cognitive attitudes were found to fully mediate the relation between logotype image and global attitude (Figure 3; Table 11).

Serial mediation analysis on logotype image
Serial multiple mediating effects of affective and cognitive attitudes on the relation between logotype image and global attitude
Brand name image was found to significantly influence affective (β=-.3256, p<.001), cognitive (β=.0806, p<.01), and global (β=-.0988, p<.001) attitudes. Affective attitude was found to positively influence cognitive (β=.5179, p<.001) and global (β=.6622, p<.001) attitudes, and cognitive attitude was found to positively influence global attitude (β=.2998, p<.001). Affective and cognitive attitudes were found to partially mediate the relation between brand name image and global attitude (Figure 4; Table 12). No serial mediation effect of affective and cognitive attitudes on the relation between typeface image and global attitude was found.

Serial mediation analysis on brand name image
Serial multiple mediating effects of affective and cognitive attitudes on the relation between the brand name image and global attitude
5. Discussion
The findings reveal that consumers manifest overall desirable attitudes toward logotypes whose brand name and typeface convey congruent rather than incongruent images. However, what contributes most significantly to increased brand memory and affective and global attitudes is a brand name that conveys small, feminine, light (vs. dark), soft, or light (vs. heavy) images such as by being concentrated with low sonority sounds. On the contrary, what contributes most significantly to increased cognitive attitude is a typeface that conveys large, masculine, dark, hard, or heavy images such as by being sans-serifed, uppercased, roman, bold, or extended.
Hence, brands whose strategic focus is to be strongly imprinted in consumers’ mind or to appear appealing, attractive, good, likable, or favorable are recommended to concentrate their brand name with low sonority sounds and visualize into a logotype using serifed, lowercased, oblique, thin, or non-extended typefaces to convey small, feminine, light (vs. dark), soft, or light (vs. heavy) images both by their brand name and their typeface such as cessie and joovy among the study stimuli. If brands are to adopt a brand name concentrated with high sonority sounds, then its visualized logotype is best to connote a consistent image by utilizing sans-serifed, uppercased, roman, bold, or extended typefaces such as YARANG and WALONG among the study stimuli. On the other hand, brands whose strategic focus is to appear useful, beneficial, and high-quality are recommended to concentrate their brand name with high sonority sounds and visualize into a logotype using sans-serifed, uppercased, roman, bold, or extended typefaces to convey large, masculine, dark, hard, or heavy images both by their brand name and their typeface, again, such as YARANG and WALONG among the study stimuli. If brands are to design their logotype using serifed, lowercased, oblique, thin, or non-extended typefaces, then the brand name is best to connote a contrasting image by being concentrated with high sonority sounds such as rawole and rauma among the study stimuli.
6. Conclusion
The present study both theoretically and practically contributes toward tactically potentiating the multisensory communicative function of brand identities for desired consumer response. Theoretically, the study objectively revealed the interactive effect of brand name and typeface in logotypes and actively bridged the research on sound symbolism and the research on visual identity design, serving as an evidential ground on which to advance multisensory brand communication research by an interdisciplinary approach. Practically, the findings provide empirical guidelines for practitioners involved in brand identity development in their intuitive decision making. Experienced managers and designers are aware of sounds and typographic characteristics eliciting certain sensations or feelings. The present study demonstrated how their efforts can collectively and effectively be merged toward developing brand identities that ideally support the strategic focus of their brand.
For this research strand to take the next necessary leap, both brand name and typeface measures should further be elaborated. Brand name image may be further segmented by employing measures that have been associated with sound perception such as the location of image-conveying phonemes (Adelman et al., 2018; Klink & Wu, 2014), the effect hierarchy of vowels and consonants (Fort et al., 2015; Klink & Wu, 2014), and the influence of repeated sounds (Argo et al., 2010). Additionally, Pretest 1 found that consumers perceive Thitto as masculine and Maula as feminine, contradicting prior literature. This is perhaps because they were rated as names of persons, impacting perceptions of brand gender. Further research is called for to assort person name patterns and incorporate into research on sound symbolism in brand naming. There also remain typographical measures untreated in the present study. Namely, letter size, letterspacing, x-height, ascender and descender lengths, stroke contrast, angle of posture, and other typeface classifications such as slab serif, glyphic, and script all influence the ultimate brand image consumers shape from the typeface adopted in brands’ visual identity. Moreover, study stimuli were restricted to the form of a logotype as it is the most essential visualization of brand identity. Other brand design elements such as symbol mark, color palette, and graphic motif nevertheless impact consumer perception and should be considered. Considering the orthographic shape of letters is also necessary to fully understand the visual image of typefaces (Bottini et al., 2019; Cuskley et al., 2017), which refers to the innate form of letters such that letters like ‘C’ and ‘O’ are round while letters like ‘H’ and ‘E’ are rectangular (Pohlen, 2015). Lastly, expanding the research on multisensory brand design to include tactile, olfactory, and gustatory images will greatly contribute to broadening our understanding of brand communication that effectively capitalizes consumers’ intrinsic mechanisms and formulating objective and evidential guidelines for the intuitive decision-making process involved in brand design.
Acknowledgments
This paper is part of Yesel Jun's doctoral thesis.
This work was supported by the Yonsei University Research Grant of 2022.
Notes
Copyright : This is an Open Access article distributed under the terms of the Creative Commons Attribution Non-Commercial License (http://creativecommons.org/licenses/by-nc/3.0/), which permits unrestricted educational and non-commercial use, provided the original work is properly cited.
References
- Aaker, D. A. (1991). Managing Brand Equity: Capitalizing on the Value of a Brand Name. In The Free Press. The Free Press.
-
Adelman, J. S., Estes, Z., & Cossu, M. (2018). Emotional sound symbolism: Languages rapidly signal valence via phonemes. Cognition, 175, 122-130.
[https://doi.org/10.1016/j.cognition.2018.02.007]

-
Argo, J. J., Popa, M., & Smith, M. C. (2010). The sound of brands. Journal of Marketing, 74, 97-109.
[https://doi.org/10.1509/jmkg.74.4.097]
-
Aryani, A., & Jacobs, A. M. (2018). Affective congruence between sound and meaning of words facilitates semantic decision. Behavioral Sciences, 8(6).
[https://doi.org/10.3390/bs8060056]
-
Baker, M. J., & Churchill, G. A. (1977). The impact of physically attractive models on advertising evaluations. Journal of Marketing Research, 14(November), 538-555.
[https://doi.org/10.1177/002224377701400411]
-
Bao, Y., Shao, A. T., & Rivers, D. (2008). Creating new brand names: Effects of relevance, connotation, and pronunciation. Journal of Advertising Research, 48(1), 148-162.
[https://doi.org/10.2501/S002184990808015X]
-
Batra, R., & Ahtola, O. T. (1991). Measuring the hedonic and utilitarian sources of consumer attitudes. Marketing Letters, 2(2), 159-170.
[https://doi.org/10.1007/BF00436035]
-
Boltz, M. G., Mangigian, G. M., & Allen, M. B. (2016). Phonetic symbolism and memory for advertisements. Applied Cognitive Psychology, 30(6), 1088-1092.
[https://doi.org/10.1002/acp.3284]
-
Bottini, R., Barilari, M., & Collignon, O. (2019). Sound symbolism in sighted and blind. The role of vision and orthography in sound-shape correspondences. Cognition, 185, 62-70.
[https://doi.org/10.1016/j.cognition.2019.01.006]
- Brumberger, E. R. (2003). The rhetoric of typography: The persona of typeface and text. Technical Communication, 50(2), 206-223.
-
Cai, Z. G., & Zhao, N. (2019). The sound of gender: inferring the gender of names in a foreign language. Journal of Cultural Cognitive Science, 3(1), 63-73.
[https://doi.org/10.1007/s41809-019-00028-2]
-
Carr, P. (1993). Phonology. Macmillan.
[https://doi.org/10.1007/978-1-349-22849-2]
-
Celhay, F., Boysselle, J., & Cohen, J. (2015). Food packages and communication through typeface design: The exoticism of exotypes. Food Quality and Preference, 39, 167-175.
[https://doi.org/10.1016/j.foodqual.2014.07.009]
-
Chen, Y. C., Huang, P. C., Woods, A., & Spence, C. (2016). When "bouba" equals "kiki": Cultural commonalities and cultural differences in sound-shape correspondences. Scientific Reports, 6(May), 1-9.
[https://doi.org/10.1038/srep26681]
-
Childers, T. L., & Jass, J. (2002). All dressed up with something to say: Effects of typeface semantic associations on brand perceptions and consumer memory. Journal of Consumer Psychology, 12(2), 93-106.
[https://doi.org/10.1207/153276602760078631]
-
Choi, H., Lee, H., Jung, M., Lee, S., & Kim, K. (2018). The effects of the phonetic symbolism of brand naming on consumer attitudes. Korean Journal of Business Administration, 31(2), 317-345.
[https://doi.org/10.18032/kaaba.2018.31.2.317]
-
Crites, S. L., Fabrigar, L. R., & Petty, R. E. (1994). Measuring the affective and cognitive properties of attitudes: Conceptual and methodological issues. Personality and Social Psychology Bulletin, 20(6), 619-634.
[https://doi.org/10.1177/0146167294206001]
-
Cuskley, C., Dingemanse, M., Kirby, S., & van Leeuwen, T. M. (2019). Cross-modal associations and synesthesia: Categorical perception and structure in vowel-color mappings in a large online sample. Behavior Research Methods, 51(4), 1651-1675.
[https://doi.org/10.3758/s13428-019-01203-7]
-
Cuskley, C., Simner, J., & Kirby, S. (2017). Phonological and orthographic influences in the bouba-kiki effect. Psychological Research, 81(1), 119-130.
[https://doi.org/10.1007/s00426-015-0709-2]
-
Davis, R. (1961). The fitness of names to drawings: A cross-cultural study in Tanganyika. British Journal of Psychology, 52(3), 259-268.
[https://doi.org/10.1111/j.2044-8295.1961.tb00788.x]
-
Davis, R. C., & Smith, H. S. (1933). Determinants of feeling tone in type faces. Journal of Applied Psychology, 17(6), 742-764.
[https://doi.org/10.1037/h0074491]
-
De Carolis, L., Marsico, E., Arnaud, V., & Coupé, C. (2018). Assessing sound symbolism: Investigating phonetic forms, visual shapes and letter fonts in an implicit bouba-kiki experimental paradigm. PLoS ONE, 13(12), 1-27.
[https://doi.org/10.1371/journal.pone.0208874]
- Delano, F. (1999). The Omnipowerful Brand: The New Gold Standard in Brand Management. Amacom.
-
Doyle, J. R., & Bottomley, P. A. (2004). Font appropriateness and brand choice. Journal of Business Research, 57(8), 873-880.
[https://doi.org/10.1016/S0148-2963(02)00487-3]
-
Doyle, J. R., & Bottomley, P. A. (2006). Dressed for the occasion: Font-product congruity in the perception of logotype. Journal of Consumer Psychology, 16(2), 112-123.
[https://doi.org/10.1207/s15327663jcp1602_2]
-
Doyle, J. R., & Bottomley, P. A. (2009). The message in the medium: Transfer of connotative meaning from typeface to names and products. Applied Cognitive Psychology, 23(3), 396-409.
[https://doi.org/10.1002/acp.1468]
-
Doyle, J. R., & Bottomley, P. A. (2011). Mixed messages in brand names: Separating the impacts of letter shape from sound symbolism. Psychology & Marketing, 28(7), 749-762.
[https://doi.org/10.1002/mar.20410]
-
Errajaa, K., Legohérel, P., Daucé, B., & Bilgihan, A. (2021). Scent marketing: linking the scent congruence with brand image. International Journal of Contemporary Hospitality Management, 33(2), 402-427.
[https://doi.org/10.1108/IJCHM-06-2020-0637]
-
Fort, M., Martin, A., & Peperkamp, S. (2015). Consonants are more important than vowels in the bouba-kiki effect. Language and Speech, 58(2), 247-266.
[https://doi.org/10.1177/0023830914534951]
- Goldsmith, J. A. (1990). Autosegmental & Metrical Phonology. Blackwell.
-
Grohmann, B. (2016). Communicating brand gender through type fonts. Journal of Marketing Communications, 22(4), 403-418.
[https://doi.org/10.1080/13527266.2014.918050]
-
Grohmann, B., Giese, J. L., & Parkman, I. D. (2013). Using type font characteristics to communicate brand personality of new brands. Journal of Brand Management, 20(5), 389-403.
[https://doi.org/10.1057/bm.2012.23]
-
Gussenhoven, C., & Jacobs, H. (2017). Understanding phonology. Routledge.
[https://doi.org/10.4324/9781315267982]
-
Hagtvedt, H. (2011). The impact of incomplete typeface logos on perceptions of the firm. Journal of Marketing, 75(4), 86-93.
[https://doi.org/10.1509/jmkg.75.4.86]
-
Haskins, J. B. (1958). Testing suitability of typefaces for editorial subject-matter. Periodicals Archive Online, 35(2), 186-194.
[https://doi.org/10.1177/107769905803500205]
- Hayes, A. F. (2022). Introduction to Mediation, Moderation, and Conditional Process Analysis : A Regression-Based Approach (3rd ed.). Guilford Press.
-
Henderson, P. W., Giese, J. L., & Cote, J. A. (2004). Impression management using typeface design. Journal of Marketing, 68(4), 60-72.
[https://doi.org/10.1509/jmkg.68.4.60.42736]
-
Heyman, T., Maerten, A. S., Vankrunkelsven, H., Voorspoels, W., & Moors, P. (2019). Sound-symbolism effects in the absence of awareness: A replication study. Psychological Science, 30(11), 1638-1647.
[https://doi.org/10.1177/0956797619875482]
-
Hillenbrand, P., Alcauter, S., Cervantes, J., & Barrios, F. (2013). Better branding: Brand names can influence consumer choice. Journal of Product & Brand Management, 22(4), 300-308.
[https://doi.org/10.1108/JPBM-04-2012-0120]
-
Hoshi, H., Kwon, N., Akita, K., & Auracher, J. (2019). Semantic associations dominate over perceptual associations in vowel-size iconicity. I-Perception, 10(4), 1-31.
[https://doi.org/10.1177/2041669519861981]
-
Huang, H., & Liu, S. Q. (2020). "Donate to help combat COVID-19!" How typeface affects the effectiveness of CSR marketing? International Journal of Contemporary Hospitality Management, 32(10), 3315-3333.
[https://doi.org/10.1108/IJCHM-05-2020-0462]
-
Huang, Y. H., Pratoomraj, S., & Johnson, R. C. (1969). Universal magnitude symbolism. Journal of Verbal Learning and Verbal Behavior, 8(1), 155-156.
[https://doi.org/10.1016/S0022-5371(69)80028-9]
-
Hung, S. M., Styles, S. J., & Hsieh, P. J. (2017). Can a word sound like a shape before you have seen it? Sound-shape mapping prior to conscous awareness. Psychological Science, 28(3), 263-275.
[https://doi.org/10.1177/0956797616677313]
-
Itagaki, S., Murai, S., & Kobayasi, K. I. (2019). Brain activity related to sound symbolism: Cross-modal effect of an aurally presented phoneme on judgment of size. Scientific Reports, 9(1).
[https://doi.org/10.1038/s41598-019-43457-3]
-
Jacobs, A. M., & Kinder, A. (2018). What makes a metaphor literary? Answers from two computational studies. Metaphor and Symbol, 33(2), 85-100.
[https://doi.org/10.1080/10926488.2018.1434943]
- Jesperson, O. (1904). Lehrbuch der Phonetik. HardPress Publishing.
-
Johansson, N., Anikin, A., & Aseyev, N. (2020). Color sound symbolism in natural languages. Language and Cognition, 12(1), 56-83.
[https://doi.org/10.1017/langcog.2019.35]
-
Jordan, T. R., Al Shamsi, A. S., Yekani, H. A. K., Al Jassmi, M., Al Dosari, N., Hermena, E. W., & Sheen, M. (2017). What's in a typeface? Evidence of the existence of print personalities in Arabic. Frontiers in Psychology, 8, 1-8.
[https://doi.org/10.3389/fpsyg.2017.01229]
-
Jun, Y., & Lee, H. (2022). A sound brand identity design: The interplay between sound symbolism and typography on brand attitude and memory. Journal of Retailing and Consumer Services, 64(September), 1-10.
[https://doi.org/10.1016/j.jretconser.2021.102724]
- Kapferer, J.-N. (2012). The New Strategic Brand Management: Advanced Insights and Strategic Thinking (5th ed.). Kogan Page.
- Katamba, F. (1989). An Introduction to Phonology. Longman.
-
Klink, R. R. (2000). Creating brand names with meaning: The use of sound symbolism. Marketing Letters, 11(1), 5-20.
[https://doi.org/10.1023/A:1008184423824]
-
Klink, R. R. (2001). Creating meaningful new brand names: A study of semantics and sound symbolism. Journal of Marketing Theory and Practice, 9(2), 27-34.
[https://doi.org/10.1080/10696679.2001.11501889]
-
Klink, R. R., & Wu, L. (2014). The role of position, type, and combination of sound symbolism imbeds in brand names. Marketing Letters, 25(1), 13-24.
[https://doi.org/10.1007/s11002-013-9236-3]
-
Kohli, C. S., Harich, K. R., & Leuthesser, L. (2005). Creating brand identity: A study of evaluation of new brand names. Journal of Business Research, 58, 1506-1515.
[https://doi.org/10.1016/j.jbusres.2004.07.007]
- Ladefoged, P., & Johnson, K. (2011). A Course in Phonetics (6th ed.). Wadsworth.
-
Lee, A. Y., & Labroo, A. A. (2004). The effect of conceptual and perceptual fluency on brand evaluation. Journal of Marketing Research, 41(2), 151-165.
[https://doi.org/10.1509/jmkr.41.2.151.28665]
-
Lee, S. Y., & Shen, F. (2009). Joint advertising and brand congruity: Effects on memory and attitudes. Journal of Promotion Management, 15(4), 484-498.
[https://doi.org/10.1080/10496490903276874]
-
Lewis, C., & Walker, P. (1989). Typographic influences on reading. British Journal of Psychology, 80, 241-257.
[https://doi.org/10.1111/j.2044-8295.1989.tb02317.x]
-
Lieven, T., Grohmann, B., Herrmann, A., Landwehr, J. R., & van Tilburg, M. (2015). The effect of brand design on brand gender perceptions and brand preference. European Journal of Marketing, 49(1), 146-169.
[https://doi.org/10.1108/EJM-08-2012-0456]
-
Low, G. S., & Lamb, C. W. (2000). The measurement and dimensionality of brand associations. Journal of Product & Brand Management, 9(6), 350-370.
[https://doi.org/10.1108/10610420010356966]
-
Lowrey, T. M., & Shrum, L. J. (2007). Phonetic symbolism and brand name preference. Journal of Consumer Research, 34(3), 406-414.
[https://doi.org/10.1086/518530]
-
Lowrey, T. M., Shrum, L. J., & Dubitsky, T. M. (2003). The relation between brand-name linguistic characteristics and brand-name memory. Journal of Advertising, 32(3), 7-17.
[https://doi.org/10.1080/00913367.2003.10639137]
-
MacKenzie, S. B., Lutz, R. J., & Belch, G. E. (1986). The role of attitude toward the ad as a mediator of advertising effectiveness: A test of competing explanations. Journal of Marketing Research, 23(2), 130-143.
[https://doi.org/10.1177/002224378602300205]
-
McCarthy, M. S., & Mothersbaugh, D. L. (2002). Effects of typographic factors in advertising-based persuasion: A general model and initial empirical tests. Psychology & Marketing, 19, 663491.
[https://doi.org/10.1002/mar.10030]
-
Miron, M. S. (1961). A crosslinguistic investigation of phonetic symbolism. Journal of Abnormal and Social Psychology, 62(3), 623-630.
[https://doi.org/10.1037/h0045212]
-
Mitchell, A. A., & Olson, J. C. (1981). Are product attribute beliefs the only mediator of advertising effects on brand attitude? Journal of Marketing Research, 18(3), 318-332.
[https://doi.org/10.2307/3150973]
-
Morris, R. A., Aquilante, K., Yager, D., & Bigelow, C. (2002). P-13: Serifs slow RSVP reading at very small sizes, but don't matter at larger sizes. SID Symposium Digest of Technical Papers, 33(1), 244.
[https://doi.org/10.1889/1.1830242]
-
Nedeljković, U., Novaković, D., & Pinćjer, I. (2017). Detecting universal structure and effects of typefaces. Tehnicki Vjesnik, 24(2), 557-564.
[https://doi.org/10.17559/tv-20150831131738]
-
Newman, S. S. (1933). Further experiments in phonetic symbolism. American Journal of Psychology, 45(2), 53-75.
[https://doi.org/10.2307/1414186]
-
North, A. C., Sheridan, L. P., & Areni, C. S. (2016). Music congruity effects on product memory, perception, and choice. Journal of Retailing, 92(1), 83-95.
[https://doi.org/10.1016/j.jretai.2015.06.001]
-
O'Boyle, M. W., Miller, D. A., & Rahmani, F. (1987). Sound-meaning relationships in speakers of Urdu and English: Evidence for a cross-cultural phonetic symbolism. Journal of Psycholinguistic Research, 16(3), 273-288.
[https://doi.org/10.1007/BF01067547]
-
O'Boyle, M. W., & Tarte, R. D. (1980). Implications for phonetic symbolism: The relationship between pure tones and geometric figures. Journal of Psycholinguistic Research, 9(6), 535-544.
[https://doi.org/10.1007/BF01068115]
-
Ohtake, Y., & Haryu, E. (2013). Investigation of the process underpinning vowel-size correspondence. Japanese Psychological Research, 55(4), 390-399.
[https://doi.org/10.1111/jpr.12029]
- Osgood, C. E., Suci, G. J., & Tannenbaum, P. (1957). The Measurement of Meaning. University of Illinois Press.
-
Pan, Y., & Schmitt, B. (1996). Language and brand attitudes: Impact of script and sound matching in Chinese and English. Journal of Consumer Psychology, 5, 263-277.
[https://doi.org/10.1207/s15327663jcp0503_03]
-
Pleyers, G. (2021). Shape congruence in product design: Impacts on automatically activated attitudes. Journal of Retailing and Consumer Services, 61(August 2019), 101935.
[https://doi.org/10.1016/j.jretconser.2019.101935]
- Pohlen, J. (2015). Letter Fountain: The Ultimate Type Reference Guide. Taschen.
-
Preziosi, M. A., & Coane, J. H. (2017). Remembering that big things sound big: Sound symbolism and associative memory. Cognitive Research: Principles and Implications, 2(10).
[https://doi.org/10.1186/s41235-016-0047-y]
-
Qiu, Q., Watanabe, S., & Omura, K. (2017). Images and anatomy of Latin typefaces. International Journal of Affective Engineering, 16(2), 121-130.
[https://doi.org/10.5057/ijae.ijae-d-16-00028]
- Ramachandran, V. S., & Hubbard, E. M. (2001). Synaesthesia: A window into perception, thought and language. Journal of Consciousness Studies, 8(12), 3-34.
-
Reber, R., Winkielman, P., & Schwarz, N. (1998). Effects of perceptual fluency on affective judgments. Psychological Science, 9(1), 45-48.
[https://doi.org/10.1111/1467-9280.00008]
-
Roethlein, B. E. (1912). The relative legibility of different faces of printing types. American Journal of Psychology, 23(1), 1-36.
[https://doi.org/10.2307/1413112]
-
Salgado-Montejo, A., Velasco, C., Olier, J. S., Alvarado, J., & Spence, C. (2014). Love for logos: Evaluating the congruency between brand symbols and typefaces and their relation to emotional words. Journal of Brand Management, 21(7/8), 635-649.
[https://doi.org/10.1057/bm.2014.29]
-
Sapir, E. (1929). A study in phonetic symbolism. Journal of Experimental Psychology, 12(3), 225-239.
[https://doi.org/10.1037/h0070931]
- Sassoon, R. (Ed.). (1993). Computers and Typography. Intellect.
-
Schiller, G. (1935). An experimental study of the appropriateness of color and type in advertising. Journal of Applied Psychology, 19(6), 652-664.
[https://doi.org/10.1037/h0056090]
-
Selkirk, E. O. (1982). The Syllable. In H. van der Hulst & N. Smith (Eds.), The Structure of Phonological Representations Part II. Foris.
[https://doi.org/10.1515/9783112423325-010]
-
Shrum, L. J., Lowrey, T. M., Luna, D., Lerman, D. B., & Liu, M. (2012). Sound symbolism effects across languages: Implications for global brand names. International Journal of Research in Marketing, 29(3), 275-279.
[https://doi.org/10.1016/j.ijresmar.2012.03.002]
-
Sun, X., Li, X., Ji, L., Han, F., Wang, H., Liu, Y., Chen, Y., Lou, Z., & Li, Z. (2018). An extended research of crossmodal correspondence between color and sound in psychology and cognitive ergonomics. PeerJ, 6, 1-24.
[https://doi.org/10.7717/peerj.4443]
-
Tannenbaum, P. H., Jacobson, H. K., & Norris, E. L. (1964). An experimental investigation of typeface connotations. Journalism Quarterly, 41(1), 65-73.
[https://doi.org/10.1177/107769906404100108]
-
Tantillo, J., Lorenzo-Aiss, J. Di, & Mathisen, R. E. (1995). Quantifying perceived differences in type styles: An exploratory study. Psychology & Marketing, 12(5), 447-457.
[https://doi.org/10.1002/mar.4220120508]
-
Teng, L., Xie, C., Liu, T., Wang, F., & Foti, L. (2021). The effects of uppercase vs. lowercase letters on consumers' perceptions and brand attitudes. Journal of Business Research, 136(January), 164-175.
[https://doi.org/10.1016/j.jbusres.2021.07.013]
-
Van Leeuwen, T. (2006). Towards a semiotics of typography. Information Design Journal, 14(2), 139-155.
[https://doi.org/10.1075/idj.14.2.06lee]
-
Van Rompay, T. J. L., & Pruyn, A. T. H. (2011). When visual product features speak the same language: Effects of shape-typeface congruence on brand perception and price expectations. Journal of Product Innovation Management, 28(4), 599-610.
[https://doi.org/10.1111/j.1540-5885.2011.00828.x]
-
Vanden Bergh, B., Collins, J., Schultz, M., & Adler, K. (1984). Sound advice on brand names. Journalism Quarterly, 61(4), 835-840.
[https://doi.org/10.1177/107769908406100415]
-
Velasco, C., Hyndman, S., & Spence, C. (2018). The role of typeface curvilinearity on taste expectations and perception. International Journal of Gastronomy and Food Science, 11, 63-74.
[https://doi.org/10.1016/j.ijgfs.2017.11.007]
-
Velasco, C., Woods, A. T., Marks, L. E., Cheok, A. D., & Spence, C. (2016). The semantic basis of taste-shape associations. PeerJ, 2016(2).
[https://doi.org/10.7717/peerj.1644]
-
Velasco, C., Woods, A. T., Wan, X., Salgado-Montejo, A., Bernal-Torres, C., Cheok, A. D., & Spence, C. (2018). The taste of typefaces in different countries and languages. Psychology of Aesthetics, Creativity, and the Arts, 12(2), 236-248.
[https://doi.org/10.1037/aca0000120]
-
Walker, P. (2016). Cross-sensory correspondences and symbolism in spoken and written language. Journal of Experimental Psychology: Learning Memory and Cognition, 42(9), 1339-1361.
[https://doi.org/10.1037/xlm0000253]
-
Walker, P., & Parameswaran, C. R. (2019). Cross-sensory correspondences in language: Vowel sounds can symbolize the felt heaviness of objects. Journal of Experimental Psychology: Learning Memory and Cognition, 45(2), 246-252.
[https://doi.org/10.1037/xlm0000583]
-
Wänke, M., Herrmann, A., & Schaffner, D. (2007). Brand name influence on brand perception. Psychology & Marketing, 24(1), 1-24.
[https://doi.org/10.1002/mar.20150]
-
Wen, N., & Lurie, N. H. (2018). The case for compatibility: Product attitudes and purchase intentions for upper versus lowercase brand names. Journal of Retailing, 94(4), 393-407.
[https://doi.org/10.1016/j.jretai.2018.10.002]
-
Westbury, C., Hollis, G., Sidhu, D. M., & Pexman, P. M. (2018). Weighing up the evidence for sound symbolism: Distributional properties predict cue strength. Journal of Memory and Language, 99, 122-150.
[https://doi.org/10.1016/j.jml.2017.09.006]
-
Whittlesea, B. W. A. (1993). Illusions of familiarity. Journal of Experimental Psychology: Learning, Memory, and Cognition, 19(6), 1235-1253.
[https://doi.org/10.1037/0278-7393.19.6.1235]
-
Winkielman, P., & Cacioppo, J. T. (2001). Mind at ease puts a smile on the face: Psychophysiological evidence that processing facilitation elicits positive affect. Journal of Personality and Social Psychology, 81(6), 989-1000.
[https://doi.org/10.1037/0022-3514.81.6.989]
-
Wu, L., Klink, R. R., & Guo, J. (2013). Creating gender brand personality with brand names: The effects of phonetic symbolism. Journal of Marketing Theory and Practice, 21(3), 319-330.
[https://doi.org/10.2753/MTP1069-6679210306]
-
Xu, X., Chen, R., & Liu, M. W. (2017). The effects of uppercase and lowercase wordmarks on brand perceptions. Marketing Letters, 28(3), 449-460.
[https://doi.org/10.1007/s11002-016-9415-0]
-
Yorkston, E., & De Mello, G. E. (2005). Linguistic gender marking and categorization. Journal of Consumer Research, 32(2), 224-234.
[https://doi.org/10.1086/432232]
-
Zaichkowsky, J. L. (2010). Strategies for distinctive brands. Journal of Brand Management, 17(8), 548-560.
[https://doi.org/10.1057/bm.2010.12]