The Anxiety Consumers Feel About Using Robotaxis: HMI Design for Anxiety Factor Analysis and Anxiety Relief Based on Field Tests
Abstract
Background This research aims to accelerate the commercialization of robotaxis (autonomous vehicles) by reducing the anxiety consumers feel about these cars and improving their experience. We plan to identify the factors causing anxiety through user experience surveys and to resolve these issues by improving the way humans and machines communicate (Human-Machine Interface). A unique aspect of this study is that it uses the ‘Wizard of Oz’ (WOZ) method for testing in real, complex road situations, which differs from past studies that mainly relied on simulations or controlled test environments.
Methods The study first conducted an online survey to determine people’s anxiety when using a robotaxi. We then created a real road course for testing. There were two field tests. The first field test was to find the key factors causing anxiety and the second field test was to evaluate human-machine interface (HMI) solutions that could help reduce that anxiety. The test tested the robotaxi service using the WOZ method under real-world conditions in the city.
Results The first field test identified 19 major anxiety factors. Based on this, 7 new (2 additional functions) HMI functions were created. A second test determined whether this HMI solution was effective in reducing anxiety. This study sheds light on how anxious people really feel when using a robotaxi and shows that proposed HMI solutions can reduce that anxiety.
Conclusions This study presents a user experience (UX) research method to investigate anxiety in robotaxi use and an HMI solution that can reduce anxiety. Additionally, HMI solutions allow for a much more realistic evaluation through field testing. Therefore, we present a practical and user-centric method to help promote better acceptance of robotaxi. These findings can serve as a guide to designing future HMIs to provide a more comfortable experience for robotaxi passengers.
Keywords:
Human-Machine Interaction (HMI), Robo-Taxis, User Experience Design, User Anxiety, Field Testing, Wizard of Oz Method1. Introduction
Recently, global companies such as Waymo, Daimler-Benz, and Renault-Nissan-Mitsubishi have been actively working toward the commercialization of robo-taxis (Mitchell, 2018; Furukawa & Yamamoto, 2019; Abuelsamid, 2018). As the commercialization of autonomous vehicles approaches, related services are expected to bring many benefits (Kang et al., 2017; Lee et al., 2019), but reliability and safety issues remain major barriers to consumer acceptance.
When a vehicle is driven by a human, the driver’s lack of driving experience, sensation-seeking tendencies, and lack of risk perception can lead to dangerous driving behaviors (Song et al., 2021), which can be factors that cause anxiety in passengers. On the other hand, in the case of fully autonomous vehicles, passengers feel discomfort or anxiety because they find it difficult to predict the vehicle’s driving style, acceleration and deceleration, and distance maintenance from other vehicles (Dettmann et al., 2021). As such, the anxiety factors experienced when riding in human-driven vehicles and fully autonomous vehicles are different, and this can affect users’ acceptance and satisfaction with autonomous driving technology. Therefore, in this study, we aim to deeply analyze the anxiety factors experienced by users when riding in fully autonomous vehicles and explore ways to alleviate them.
1. 1. Related Work
Various studies have been conducted on the perception and anxiety of passengers in autonomous vehicles. Dillen et al. (2020) found that the fixed driving style of autonomous vehicles may cause discomfort or anxiety when it does not match individual passengers’ preferences. Meanwhile, Lu et al. (2022) constructed a model to investigate the relationship between state anxiety, situation awareness, trust, and role adaptation for passengers. Chakravarthi et al. (2024) demonstrated that interaction with a simple robotic object placed on the vehicle’s dashboard can help secure passengers’ trust. Similarly, Shahrdar et al. (2019), Eom & Lee (2022), and Lee et al. (2016) focused on evaluating passenger perception, designing HMIs, and reducing anxiety in controlled environments or simulators.
However, most of these studies were conducted in limited settings, and there are limitations in identifying the anxiety factors experienced by users in complex public road environments. Ghazizadeh et al. (2012) emphasized the importance of collecting user experience data on actual roads to advance the commercialization of robo-taxis. This study differs from previous research in that it deeply analyzes users’ anxiety factors through a driving experiment lasting approximately one hour in an actual urban environment and suggests HMI design methods based on the findings.
1. 2. Research Framework
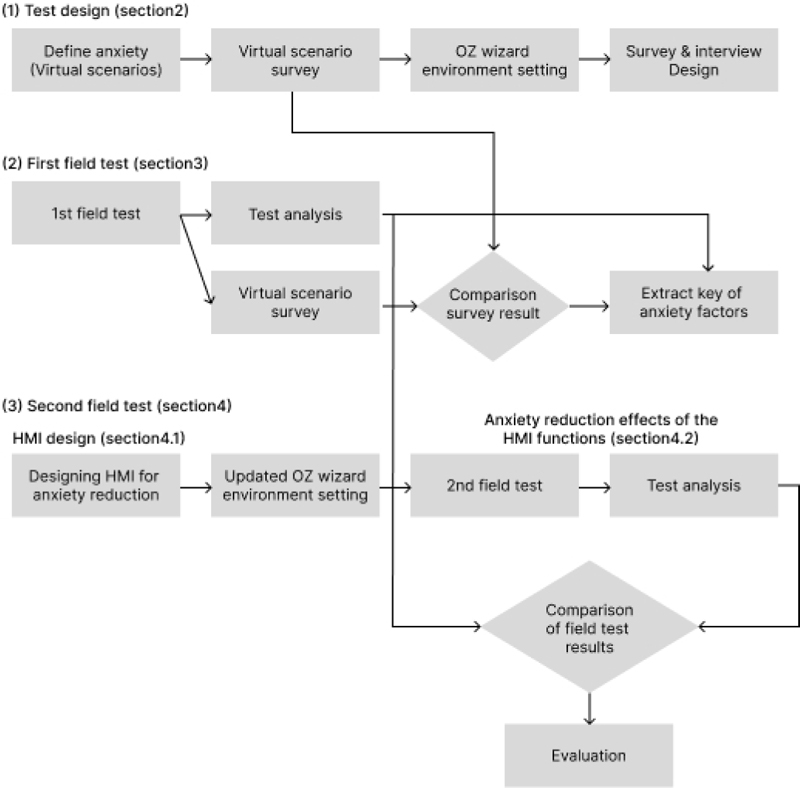
Figure 1 illustrates the research framework of this study. Initially, an online survey was employed to investigate the anxiety experienced. The findings from this survey led to the first field test, which aimed to identify the main factors that cause anxiety. Subsequently, a Human-Machine Interface (HMI) was developed to reduce user anxiety. The effectiveness of this HMI was then assessed in a second field test. The paper is organized as follows: Section 2 introduces the testing methods, Section 3 summarizes the results and anxiety factors from the first field test, Section 4 proposes an HMI solution to these factors and details the second field test results, and Section 5 discusses the overall findings and conclusions.
2. Test design
In the test design phase, scenarios causing anxiety in autonomous vehicles were created, and a survey assessed expected anxiety levels for each. A robo-taxi, in-vehicle display, passenger mobile application, and a control tower system for Wizard of Oz (WOZ) experiments were set up. Pre- and post-field test interviews, along with questionnaires, were also prepared.
2.1. Design of anxiety scenarios and routes
Eighty-four anxiety-inducing scenarios were brainstormed for autonomous vehicle experiences. To assess realistically, participants were asked to imagine themselves as passengers in a car with an inexperienced human driver. An online survey involving 309 respondents was conducted, where participants rated their anxiety levels for 22 scenarios on a 7-point scale. Table 1 displays the online survey results of anxiety scenarios.
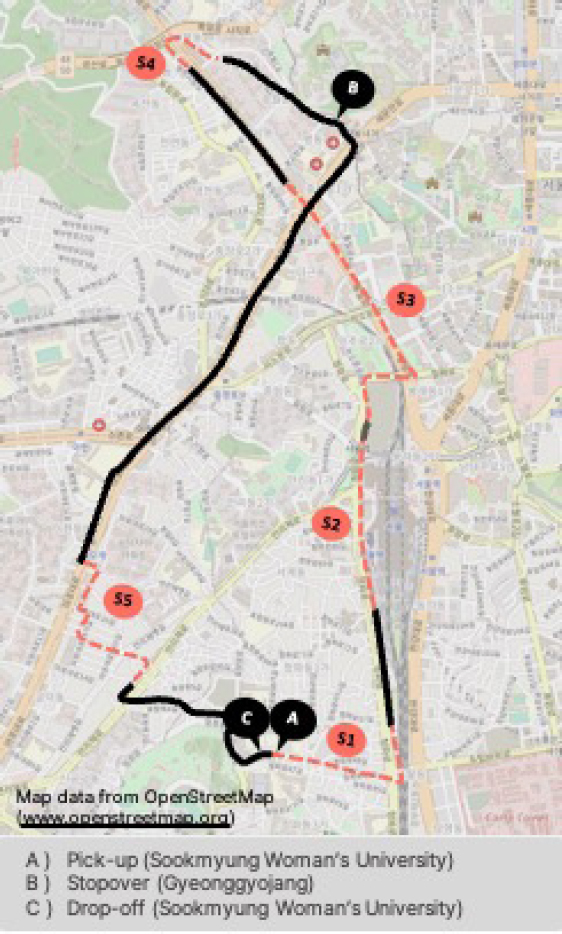
Routes for testing the selected anxiety-inducing scenarios were designated. The test route started and ended at Sookmyung Women’s University and took approximately 60 minutes. Figure 2 represents the experimental path.
The S1 section, which has a two-lane road and a right turn road in front of the school, was congested with pedestrians jaywalking and motorcycles. Section S2 was near a train station with heavy traffic. Section S3 consisted of a series of intersections and turns, making it suitable for high-speed turning scenarios. The S4 section in front of an apartment complex to test ‘accident notification’ and the S5 section for high-speed driving in narrow alleys were also included.
2. 2. Experimental environment design
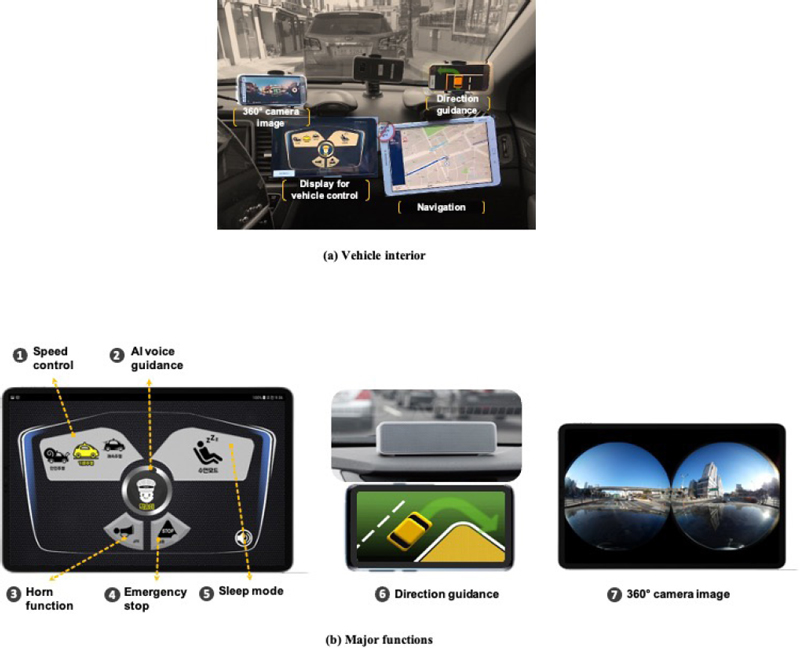
The robo-taxi service comprised four steps: (1) calling, (2) boarding, (3) traveling, and (4) disembarking. For the services required at each step, a mobile appand an in-vehicle interaction display were developed. For the robo taxi, black partitions were installed surrounding the driver’s seat to separate it from the passengers’ seat. Therefore, the participants could not see the driver. Inside the vehicle, a camera was installed in the passenger seat to monitor the user’s activities. The Fig 3 shows the robo-taxi’s interior environment.
The driver performing the role of the robo-taxi was provided with the following guidelines. First, prioritize safety while driving and minimize lane changes as much as possible. Second, yield to other vehicles attempting to cut in and maintain a safe distance between vehicles. Third, when encountering a moving obstacle, wait until the obstacle is clear. Fourth, in narrow streets, if encountering another vehicle, stop on one side and yield to the other vehicle. This allowed the robo-taxi to maintain safety while providing participants with a consistent autonomous driving experience.
2. 3. Design of interviews and surveys
The study was approved by the Institutional Review Board (IRB) of Sookmyung Women’s University and included surveys, interviews, and observational research. Figure 4 shows examples of clicker and video interviews. Participants used a clicker app to indicate when they felt anxious during the robotaxi experience. Anxiety levels were measured on a 7-point scale. Surveys were conducted before and after each field test.
The field tests consisted of preliminary tests and main tests, and the participant information for each test is as follows:
Preliminary Tests
■ 1st: Number of participants: 3 (2 females in 20s, 1 male in 30s)
■ 2nd: Number of participants: 1 (1 female in 30s)
Main Tests
■ 1st:
- • Internal: Number of participants: 12 (11 in their 20s, 1 female in 40s; students and researchers)
- • External: Number of participants: 6 (1 male and 1 female each in 30s, 40s, and 50s; various occupations)
■ 2nd: Number of participants: 6 (1 male and 1 female each in 30s, 40s, and 50s; various occupations)
Table 2 shows the pre-survey results of the driving experience, driving frequency, and taxi usage frequency of the participants in the 1st and 2nd main tests. The driving experience was measured on a scale from 1 (none) to 5 (more than 10 years), the driving frequency from 1 (do not drive) to 4 (every day), and the taxi usage frequency from 1 (do not use) to 5 (every day). The means and standard deviations are presented for all participants and internal participants of the 1st main test, as well as for the participants of the 2nd main test. The study aimed to gain a deep understanding of the participants’ experiences and collect data through various methods such as pre-interviews, questionnaire interviews, video interviews, follow-up interviews, and final interviews.
3. First field test
This section shows the major factors affecting the anxieties. Section 3.1 shows the results of analyzing the clicker usage. Section 3.2 analyzes the results of in-depth interviews, Section 3.3 summarizes the major factors that affect anxiety.
3. 1. Analysis of anxiety factors based on clicker usage results
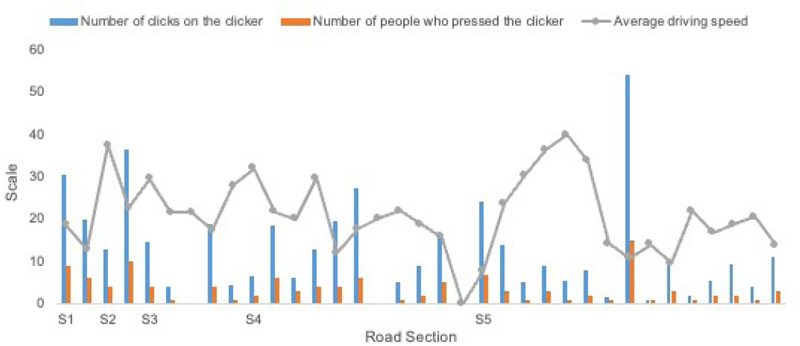
We assumed that not only the intensity of anxiety but also the frequency of its occurrence is important. The number of clicks during the experiment can quantitatively measure.
Table 3 shows the anxiety factors reported by the participants in the 1st test, the degree of anxiety (A), the number of clicks on the clicker (B), and the number of users who pressed the clicker (C). The total score was obtained by multiplying the degree of anxiety (A) by the number of clicks (B). Based on this, the importance rankings were determined.
The primary concerns regarding robo-taxis, as identified through passenger interviews, revolve around how these robo-taxis handle external situations such as interacting with other vehicles and pedestrians. The top five anxiety factors include:
Cut-in: Passengers expressed anxiety about the robo-taxi’s overly cautious response to vehicles cutting in, potentially leading to increased travel time. For instance, one participant noted, “I felt anxious because the robo-taxi allowed all cut-in vehicles... I thought it could defeat the purpose of fast travel” (p19).
Turning: Anxiety arose when the robo-taxi made turns, especially U-turns or left turns, in close proximity to other vehicles. A participant recounted feeling anxious when “the robo-taxi was close to colliding with another taxi while making a U-turn” (p21).
Pedestrian: Concerns were raised about the robo-taxi’s ability to detect and respond to jaywalking pedestrians. For example, a passenger worried about whether the robo-taxi could “detect the pedestrians properly” during traffic (p21).
Illegal Parking: Anxiety was triggered when the robo-taxi had to maneuver around illegally parked vehicles, such as crossing the centerline.
Alleyways: Traveling through narrow and crowded alleyways, filled with parked vehicles and pedestrians, also caused passenger anxiety.
The study explored the link between anxiety and speed in autonomous vehicles by analyzing the relationship between driving speed and anxiety levels, as indicated by clicker responses. Surprisingly, higher anxiety was noted at lower speeds, and vice versa. The analysis, particularly in alley sections, suggested that anxiety is more related to specific environmental factors than to the speed of the robo-taxi.3.2. Anxiety factor analysis through in-depth interviews
Table 4 shows how field tester and online respondent’ perceptions differed for each virtual scenario.
Both groups identified “Pedestrian suddenly jumps from a crosswalk” as the most anxiety inducing situation. There were notable differences in other scenarios. Online respondents felt more anxious about “Traveling at high speeds in a narrow alley” and “Turning at high speed without slowing down”, while “Navigation system stops responding” was more concerning for field tester. Ranking shifts were observed in several scenarios, indicating differences in perceive of each group.
Participants were interviewed, Out of 28 overlapping answers to “do you have any concerns over the robo-taxi service?”, 53% mentioned concerns about the technology’s reliability. Other responses highlighted inconvenience due to the lack of passenger control and communication with the robo-taxi. “In a conventional taxi, prompt responses are possible in accidents, but in the robo-taxi, there’s no one to communicate with.” (p08)
40% of 25 overlapping responses indicated anxiety due to the robo-taxi’s inflexible driving. Compared to conventional taxis, which sometimes bend traffic rules for faster travel, the robo-taxi’s adherence to rules and lower speeds increased discomfort and anxiety. “I use taxis for quicker travel, but the robo-taxi didn’t meet this expectation.” (p01)
Other concerns included reliability, lack of communication and information. “The system’s lack of communication with passengers was uncomfortable.” (p05)
35% of 23 respondents cited external factors like dangerous cut-ins, jaywalking pedestrians, and narrow alleys as the most anxiety-inducing. “I felt anxious due to other vehicles cutting in or coming too close.” (p17)
In response to “what would you do if the robo-taxi showed abnormal actions?”, 41% emphasized the need for a control tower connection, while 38% suggested forcibly stopping the vehicle. Suggestions for problem resolution included calling another taxi or waiting in the vehicle. Concerns about control tower privacy intrusion were also noted. “A control tower is necessary for emergency responses, but it raises privacy concerns.” (p19)
3. 3. Summary of the derived anxiety factors
The primary anxiety factors identified from the analysis in Sections 3.1 to 3.2 are outlined in Table 5. These include the top ten factors chosen from clicker use results, five factors not tested in field tests but highlighted in virtual scenario evaluations, and four key factors from in-depth interviews.
To derive HMI solutions that can address the main anxiety factors, this study selected seven functions (speed control, AI voice guidance, horn, emergency stop, direction guidance, surrounding video feed, sleep mode) considering intuitiveness, and safety.
Each selected HMI function was designed with a focus on resolving specific anxiety factors. The speed control function alleviates anxiety caused by fixed speeds by giving passengers control over the speed, and the AI voice guidance function aims to increase system reliability and reduce anxiety caused by lack of information by informing passengers of the robo-taxi’s perception of pedestrians or obstacles. Additionally, the emergency stop function was designed to resolve anxiety caused by being out of control by allowing passengers to safely stop the vehicle in case of an emergency. In this way, the HMI functions reflect the requirements for resolving anxiety factors, and detailed explanations of each function will be covered in the next section.
4. Second Field Test
4. 1. HMI Design
We proposed and designed HMI solutions for the major anxiety factors identified from the first field test results. Table 6 explains how each HMI function directly addresses the major anxiety factors identified in the first field test. Strange warning sounds, navigation system malfunctions, and blinker malfunctions are integrated under “abnormal operation.”
Table 7 shows additional features that are not intended to reduce anxiety, but are intended to address passenger pain points that emerged during first field testing.
The HMI functions are illustrated in Figure 6.
In the 1st field test, participants felt uncomfortable due to the excessive cruise control of the robo-taxi. To address this, a feature was added that allowed passengers to directly control the speed at which they felt comfortable. Many participants in the 1st field test felt uncomfortable because they couldn’t communicate with the robo-taxi. An AI speaker was installed to facilitate communication between passengers and the vehicle. Participants wanted the ability to sound the horn to warn other vehicles or pedestrians in emergency situations. An emergency stop button was added, allowing passengers to halt the vehicle if they encountered an emergency or abnormal driving. An animation feature was introduced to help passengers identify the turning direction of the vehicle when the blinker was activated. A real-time 360° surrounding camera was added to address concerns about not properly seeing emergency vehicles, especially when they were approaching from behind. An environment was created for passengers to sleep in the robo-taxi, and a system to wake passengers at their destination was introduced. This aimed to reduce overall passenger anxiety. A departure button was added to inform passengers about the vehicle’s readiness for departure, addressing anxiety about waiting without information. To assist passengers in locating the vehicle, it now honked twice when a passenger was within 3 meters and unfolded its rear-view mirrors at 1 meter, making it easier to identify. These improvements were made based on feedback and experiences gathered during the 1st field test to enhance the overall passenger experience and reduce anxiety.
4. 2. Second field test
In this section, the anxiety reduction effects of the HMI functions designed in Section 4.1 are verified through the 2nd field test, with a robo-taxi equipped with these functions. The 2nd field test was conducted on the same route as the 1st field test. Table 8 shows the clicker use results of the 2nd field test. The change represents a difference from the degree of anxiety in the 1st field test.
The results of this study are an analysis of factors commonly found in the first and second field tests. It’s noteworthy that anxiety about factors such as ‘inflexible driving,’ ‘turns,’ ‘obstacles on the road,’ ‘pedestrians,’ and ‘sudden lane changes,’ which were frequently mentioned by participants in the first field test, was significantly reduced. Among these factors, anxiety related to ‘sudden stops’ experienced the greatest decrease, dropping by 2.25 points.
Factors frequently mentioned by participants in the first field test were significantly reduced in the second field test, with no mention of ‘illegal parking’ at all. Although the number of participants was small, the significant reduction in anxiety factors suggests that the HMI functionality was effective.
In the second field test, ‘distance between vehicles’ and ‘obstacles on the road’ emerged as new anxiety factors. ‘Distance between vehicles’ refers to the distance between the robotaxi the participant is riding and other vehicles, and ‘obstacles on the road’ refers to animals or objects on the road. Participants noted that a regular taxi driver would be able to handle this situation well than robo-taxi. On the other hand, robotaxi would be able to reduce anxiety if it provided enough voice messages to indicate the possibility of conflict with external factors. The interview answers related to this are below.
‘As another vehicle approached, I was worried about a collision. If it had been a regular taxi I would have told the driver it was too close...’ (p27)
‘The robo-taxi drove quickly without avoiding many pigeons on the road. A regular taxi would have handled the situation better. ...’ (p24)
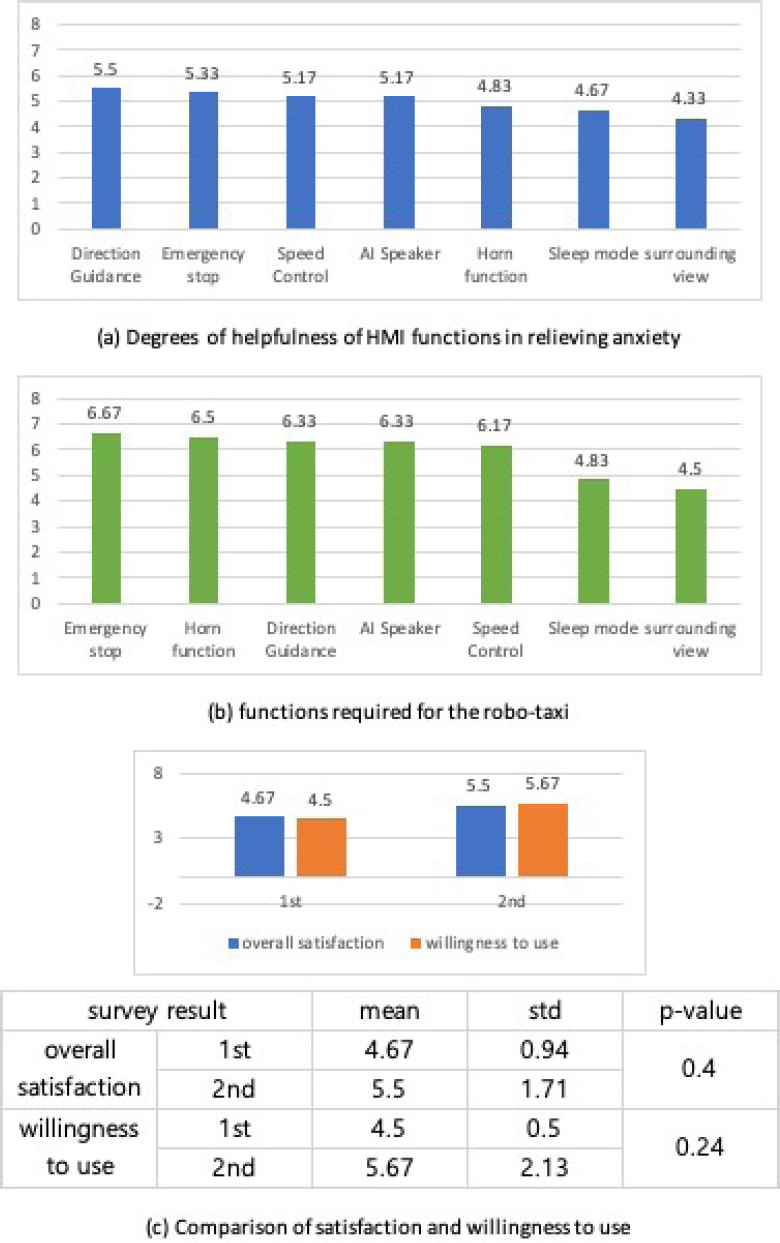
For more quantitative evaluation, a survey was conducted to evaluate the helpfulness of HMI functions in relieving anxiety using a 7-point scale. These results indicated in Figure 7(a), show that all HMI functions scored four points or higher, demonstrating their effectiveness in reducing anxiety. Some functions such as direction guidance, emergency stop, speed control, and AI voice guidance scored six points or higher. Another survey, the results of which are shown in Figure 7(b), inquired about the essential functions for robo-taxis. It revealed that the horn function was rated as the second most important, underscoring its significance for communication with the external environment. The participants evaluated overall satisfaction and willingness to use the robo-taxi service. The results of the 2nd field test, which included HMI functions, indicated higher satisfaction and willingness compared to the 1st field test without HMI functions, confirming that the addition of HMI functions reduced anxiety and improved the robo-taxi usage experience. The vehicle search function received a high rating of 5.33 points on a 7-point scale.
Survey and interview materials, as well as the results, can be found at the following link: https://drive.google.com/drive/folders/18_-c59PIPQ5_m9_8wdzmhv662TBkmruB?usp=drive_link
5. Discussion and Conclusion
5. 1. Discussion
The insights for reducing robo-taxi anxieties, obtained from the two field tests, are summarized as follows. They will be helpful as guidelines for future robo-taxi HMI development. The robo-taxi should exhibit flexibility in its driving behavior. While the study implemented a 3-level speed control function that reduced anxiety, feedback indicated a need for even greater driving flexibility. In particular, during external accidents, the robo-taxi should provide detailed information about the situation and be able to navigate around the incident. Interaction with external elements, such as other vehicles and pedestrians, is essential to reduce anxiety. Major anxiety factors were related to external factors like cut-ins, reckless driving, protruding vehicles, external horn sounds, and pedestrian behavior. Many participants expressed low confidence in robo-taxi technology, mainly due to concerns about accidents and faults. Basic functions to alleviate robo-taxi anxiety were identified. Seven major HMI functions were designed, with direct guidance, emergency stop, speed control, and AI voice guidance functions showing effectiveness in relieving anxiety. Interestingly, there was no significant correlation between vehicle speed and passenger anxiety. Analysis of clicker usage records showed that passenger anxiety was primarily influenced by surrounding elements, and sections where high anxiety was experienced had a low correlation with the vehicle’s speed.
5. 2. Conclusion
The study focused on addressing customer anxieties related to autonomous vehicles, given the increasing commercialization of robo-taxi services. The objective was to provide real-world robo-taxi usage experiences in complex urban settings, identify anxiety-inducing factors during these experiences, and propose Human-Machine Interface (HMI) solutions to mitigate these factors. The Wizard of Oz (WOZ) methodology was employed to implement a robo-taxi service in downtown Seoul, involving a one-hour field-test with 28 participants. Although the WOZ methodology may not fully replicate real-world scenarios, 74% of participants believed the robo-taxis to be authentic after the experiment. From the first field test, 19 major anxiety factors were identified, and seven HMI functions were designed to address these concerns.
However, there were limitations to the study. The scale and diversity of the participants were limited. Out of the 28 participants, 25% were male, and 75% were female, indicating an unbalanced gender distribution. Moreover, the study did not include a wide range of age groups and driving experiences, which may limit the generalizability of the findings.
Constraints on time and budget limited the number of participants in the experiment. Lengthy experimental sessions and interviews led to reduced participant recall in the latter half of the study. Blind spots in camera coverage prevented the recording of some dangerous incidents, limiting the capture of anxiety-inducing situations.
Future research should aim to recruit a larger and more diverse sample of participants, with a balanced consideration of gender, age, and driving experience. This would enable a more generalizable understanding of the anxiety factors experienced by users from various backgrounds and provide a more robust validation of the effectiveness of the proposed HMI solutions.
Additionally, collecting long-term user experience data in real-world driving conditions would be valuable to identify anxiety factors in a broader range of situations and assess the long-term impact of the HMI solutions.
Despite these limitations, this study supports the development of a user-friendly autonomous vehicle system by identifying and solving users’ anxiety factors. This is essential for gaining public trust and acceptance, and can serve as an important guide for future research. Self-driving cars have the potential to reduce traffic accidents caused by human error, increase mobility for the vulnerable, and reduce traffic congestion and environmental impact through optimized driving. This study contributes to realizing this social contribution by providing insight into user experience and effective HMI solutions. In conclusion, this study not only provides guidelines in the field of autonomous vehicle HMI design, but also promotes the introduction of autonomous vehicles, ultimately contributing to the implementation of a safer and more efficient transportation system.
Acknowledgments
This work was supported by Hyundai Motor Company and the National Research Foundation of Korea (NRF) grant funded by the Korean government (No.2018R1A5A7025409). The authors wish to thank Eunju Jeong, Ah-hyeon Jin, Seohui Joung, Woojin Kwak, Gyuwon Lee, Jihyun Lee, Yunha Park, Hanyoung Ryu and Seungyeon Shin, who were undergraduate intern researchers in the department of Mechanical Systems Engineering of Sookmyung Women’s University, for their support in setting the tests, conducting surveys, and summarizing the survey results. There was no additional external funding received for this study.
Notes
Copyright : This is an Open Access article distributed under the terms of the Creative Commons Attribution Non-Commercial License (http://creativecommons.org/licenses/by-nc/3.0/), which permits unrestricted educational and non-commercial use, provided the original work is properly cited.
References
- Abuelsamid, S. (2018). Daimler and Bosch choose San Jose for their Silicon Valley robo-taxi service. Forbes. Retrieved from https://www.forbes.com/sites/samabuelsamid/2018/11/08/daimler-and-bosch-to-launch-automated-mobility-pilot-in-san-jose-in-2019/#19ca2828601b.
-
Chakravarthi Kumaran, S., Bechor, T., & Erel, H. (2024). A social approach for autonomous vehicles: A robotic object to enhance passengers' sense of safety and trust. In Proceedings of the 2024 ACM/IEEE International Conference on Human-Robot Interaction (pp. 86-95).
[https://doi.org/10.1145/3610977.3634998]

-
Dettmann, A., Hartwich, F., Roßner, P., Beggiato, M., Felbel, K., Krems, J., & Bullinger, A. C. (2021). Comfort or not? Automated driving style and user characteristics causing human discomfort in automated driving. International Journal of Human-Computer Interaction, 37(4), 331-339.
[https://doi.org/10.1080/10447318.2020.1860518]

-
Dillen, N., Ilievski, M., Law, E., Nacke, L. E., Czarnecki, K., & Schneider, O. (2020, April). Keep calm and ride along: Passenger comfort and anxiety as physiological responses to autonomous driving styles. In Proceedings of the 2020 CHI Conference on Human Factors in Computing Systems (pp. 1-13).
[https://doi.org/10.1145/3313831.3376247]

-
Eom, H., & Lee, S. H. (2022). Mode confusion of human-machine interfaces for automated vehicles. Journal of Computational Design and Engineering, 9(5), 1995-2009.
[https://doi.org/10.1093/jcde/qwac088]

-
Faas, S. M., Stange, V., & Baumann, M. (2021). Self-driving vehicles and pedestrian interaction: Does an external human-machine interface mitigate the threat of a tinted windshield or a distracted driver? International Journal of Human-Computer Interaction, 37(14), 1364-1374.
[https://doi.org/10.1080/10447318.2021.1886483]

- Furukawa, K., & Yamamoto, N. (2019). Nissan-Renault alliance to join Google on self-driving cars. The Nikkei. Retrieved from https://asia.nikkei.com/Business/Companies/Nissan-Renault-alliance-to-join-Google-on-self-driving-cars.
-
Ghazizadeh, M., Peng, Y., Lee, J. D., & Boyle, L. N. (2012). Augmenting the technology acceptance model with trust: Commercial drivers' attitudes towards monitoring and feedback. Proceedings of the Human Factors and Ergonomics Society Annual Meeting, 56(1), 2286-2290.
[https://doi.org/10.1177/1071181312561481]

-
Kang, N., Feinberg, F. M., & Papalambros, P. Y. (2017). Autonomous electric vehicle sharing system design. Journal of Mechanical Design, 139(1), 011402.
[https://doi.org/10.1115/1.4034471]

-
Kim, S., Chang, J., Park, H. H., Song, S. U., Cha, C. B., Kim, J. W., et al. (2020). Autonomous taxi service design and user experience. International Journal of Human-Computer Interaction, 36(5), 429-448.
[https://doi.org/10.1080/10447318.2019.1653556]

-
Lee, J., Kim, N., Imm, C., Kim, B., Yi, K., & Kim, J. (2016). A question of trust: An ethnographic study of automated cars on real roads. Proceedings of the 8th International Conference on Automotive User Interfaces and Interactive Vehicular Applications (pp. 201-208).
[https://doi.org/10.1145/3003715.3005405]

-
Lee, U., Kang, N., & Lee, I. (2019). Shared autonomous electric vehicle design and operations under uncertainties: A reliability-based design optimization approach. Structural and Multidisciplinary Optimization, 1-17.
[https://doi.org/10.1007/s00158-019-02434-0]

-
Lu, Y., Yi, B., Song, X., Zhao, S., Wang, J., & Cao, H. (2022). Can we adapt to highly automated vehicles as passengers? The mediating effect of trust and situational awareness on role adaption moderated by automated driving style. Transportation Research Part F: Traffic Psychology and Behaviour, 90, 269-286.
[https://doi.org/10.1016/j.trf.2022.08.011]

- Mitchell, R. (2018). Waymo One, the first commercial robotaxi service, is now picking up passengers in Arizona. Los Angeles Times. Retrieved from https://www.latimes.com/business/autos/la-fi-hy-waymo-one-20181205-story.html.
-
Noh, S., & An, K. (2022). Reliable, robust, and comprehensive risk assessment framework for urban autonomous driving. Journal of Computational Design and Engineering, 9(5), 1680-1698.
[https://doi.org/10.1093/jcde/qwac079]

-
Rothenbücher, D., Li, J., Sirkin, D., Mok, B., & Ju, W. (2016). Ghost driver: A field study investigating the interaction between pedestrians and driverless vehicles. 2016 25th IEEE International Symposium on Robot and Human Interactive Communication(RO-MAN), 795-802.
[https://doi.org/10.1109/ROMAN.2016.7745210]

-
Shahrdar, S., Park, C., & Nojoumian, M. (2019). Human trust measurement using an immersive virtual reality autonomous vehicle simulator. AAAI/ACM Conference on AI. Retrieved from aaai.org.
[https://doi.org/10.1145/3306618.3314264]

-
Song, X., Yin, Y., Cao, H., Zhao, S., Li, M., & Yi, B. (2021). The mediating effect of driver characteristics on risky driving behaviors moderated by gender, and the classification model of driver's driving risk. Accident Analysis & Prevention, 153, 106038.
[https://doi.org/10.1016/j.aap.2021.106038]

