
Accelerating Performance: Development and Evaluation of Soccer Cleats Embedded with Biometric Cleats
Abstract
Background Footwear design plays a crucial role in sprint performance by influencing biomechanical function, force transfer, and physiological response during acceleration. However, limited studies have investigated how specific cleat design features such as forefoot flexibility and toe up structure affect sprint acceleration. This study aims to develop and evaluate two soccer cleat prototypes integrating biomechanical and structural design elements to enhance propulsion and performance in soccer.
Methods Two cleat models were developed: Prototype Regular Cleats with stitched forefoot lines and Prototype Band Cleats with an elastic forefoot band. Both incorporated a 1 mm carbon fiber plate, a 25° toe up structure, and a mid-high arch to promote forefoot engagement. The Nike Mercurial Vapor 16 AG, featuring a 15° toe up forefoot, served as a commercial benchmark. Twenty male players (14 amateur and 6 college pro level) completed 40 m sprint trials under all three footwear conditions. Oxygen consumption (VO2), heart rate, and sprint time were analyzed using a repeated measures one-way analysis of variance (ANOVA) to account for the within-subject experimental design. Post hoc pairwise comparisons were conducted using Bonferroni correction to identify differences between footwear conditions.
Results Performance differences were observed among the three cleat conditions. Prototype Band Cleats demonstrated the fastest sprint times and the highest volume of oxygen (VO2) values, indicating greater physiological demand during sprint acceleration. Across all participants, Prototype Band Cleats achieved significantly faster sprint times than Prototype Regular Cleats (p < .05) and significantly higher VO2 than Prototype Regular Cleats (p < .01). Among college pro players, Prototype Band Cleats produced significantly faster sprint times than the Nike condition (p < .05).
Conclusions Design features such as an elastic forefoot band, elevated arch, and 25° toe up structure may enhance acceleration by promoting forefoot loading and suggesting a potential for improved energy return. These findings highlight how design driven biomechanical optimization can advance performance-oriented footwear innovation in soccer.
Keywords:
Soccer Cleats, Sprint Performance, Footwear Biomechanics, Forefoot Flexibility1. Introduction
Soccer is a globally played sport characterized by high physical demands, including sprinting, rapid acceleration, and frequent changes in direction (Datson et al., 2017; Martínez-Lagunas et al., 2014). Among these movements, sprinting ability plays a critical role in performance, particularly during decisive moments such as ball possession, defensive recovery, and goal scoring opportunities (Cometti et al., 2001; Stølen et al., 2005). Match analyses have shown that players repeatedly perform short duration sprints lasting approximately 2–4 seconds, highlighting the importance of rapid acceleration and maximal speed in competitive soccer (Andrzejewski et al., 2013; Bradley et al., 2010). Increasing intensity of soccer matches resulted in athletes to effectively meet the game’s high physical demands (Carling et al., 2012). Athletes continuously strive to be the best to improve their rapid acceleration while effectively reaching their highest form of proficiency (Ericsson, 2020; Macnamara et al., 2014). Accordingly, the growing emphasis on rapid acceleration in soccer has increased attention toward equipment design that supports sprint performance.
Soccer cleats are a key piece of equipment influencing sprint performance (McPoil, 2000; Sterzing, 2016). The design of the footwear influences the athletes’ sprinting speed ability (Hennig & Sterzing, 2010). Especially, modern speed soccer cleats were designed to be lightweight while it also provided barefoot feel to be favored by players. However, it often lead to minimal shock absorption and support, leading to sacrificing comfort and sprint performance (Dri, 2024; Lill, 2021). Despite soccer cleats being essential in enhancing player performance through speed and comfort during play, there is a lack of research on the design elements of soccer cleats, especially considering their significant impact on the sport (Hennig & Sterzing, 2010; Okholm Kryger et al., 2021). This study aimed to evaluate the biomechanical design of speed soccer cleats and determine their impact on performance during sprinting movements.
Since soccer has widely been embraced and its huge influences on the economy, the designing of equipment like soccer cleats becomes highly significant these days. It has continuously had high demands and expectations from the athletes in order to achieve athletes’ highest performance in sprinting thus becoming effective during the game. Today’s soccer cleats were characterized by insufficient support and small shock absorption. With this aim in mind, this study was aimed at enhancing athletes’ speed during running. It also analyzed the effect of custom soccer cleats against modern day speed soccer cleats (Figure 1). The objective of this study was to gain insight into how to develop speed soccer cleats for amateur and college pro players.
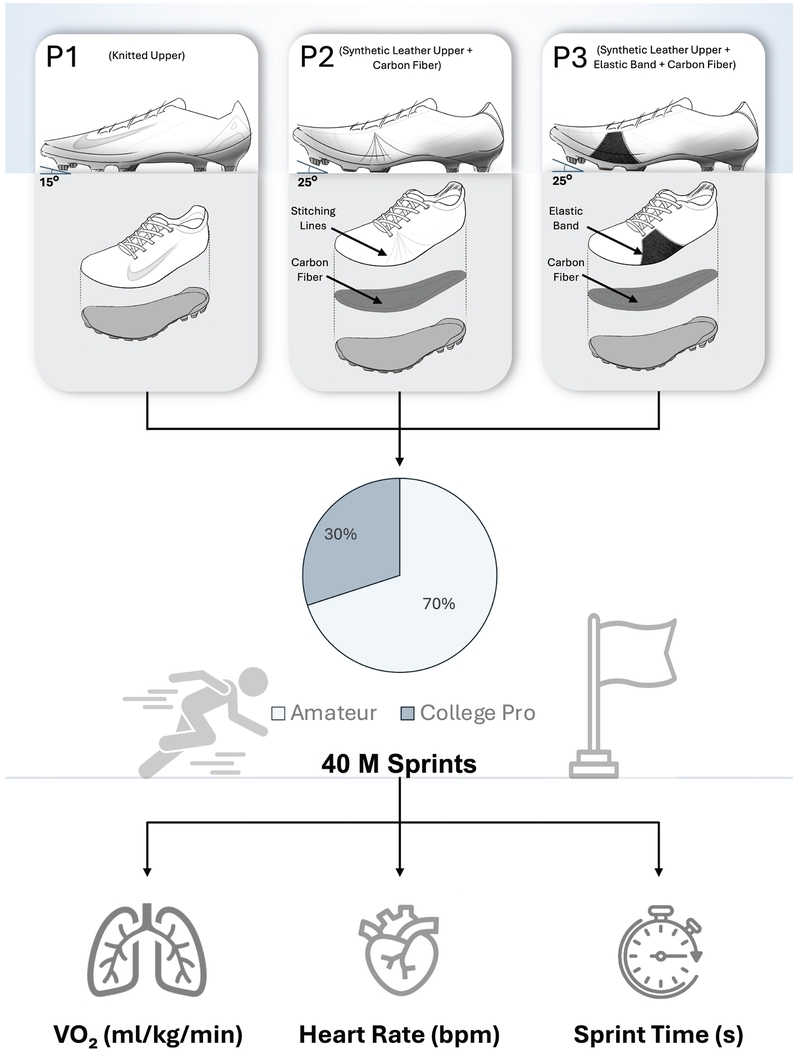
Schematic overview of sprint performance analysis for three different products of soccer cleats.Note: This figure illustrates the experimental setup for analyzing sprint performance under three footwear conditions: (Product 1) Nike Mercurial Vapor 16 AG, (Product 2) Prototype Regular Cleats, and (Product 3) Prototype Band Cleats. Twenty male participants, including amateur and college pro soccer players, performed standardized 40 m sprint trials on a synthetic grass field. The schematic depicts the data collection process for measuring Volume of Oxygen Consumption (VO₂), Heart Rate (HR), and sprint time across cleat types, enabling evaluation of biomechanical and physiological differences in sprint performance.
2. Literature Review
2. 1. Sprint Demands and Forefoot Mechanics in Soccer
Sprint performance plays a critical role in decisive moments of soccer matches, including goal-scoring opportunities, defensive recovery, and rapid transitions between phases of play. Match analysis studies using global positioning systems (GPS) have shown that outfield players typically cover 9–12 km per match, with approximately 8–12% of this distance performed at high intensity (Di Salvo et al., 2007; Rampinini et al., 2007a, 2007b; Vigne et al., 2010). Players may perform 17–81 sprints per game, with each sprint lasting 2–4 seconds and generally covering distances shorter than 20 m. Peak sprinting speeds can reach 31–32 km·h□1, particularly during straight-line accelerations (Di Salvo et al., 2007; Rampinini et al., 2007a & 2007b; Vigne et al., 2010). Sprinting mechanics in soccer are characterized by forefoot contact, especially during acceleration and maximal sprint phases (Scott & Winter, 1993; Tourillon et al., 2019). Forefoot running allows shorter ground contact times and rapid force application, both of which are essential for effective sprint performance. The metatarsophalangeal (MTP) joint plays a central biomechanical role by enabling controlled extension during ground contact and facilitating efficient force transfer during propulsion (Scott & Winter, 1993; Tourillon et al., 2019). During high speed sprinting, extension of the MTP joint allows mechanical energy to be absorbed by musculoskeletal structures and subsequently contributes to forward propulsion during toe off (Stefanyshyn & Nigg, 1997). Effective engagement of the forefoot region and MTP joint is therefore considered a key biomechanical component of sprint acceleration and performance in soccer.
2. 2. Footwear Flexibility and Bending Stiffness in Sprinting
Footwear properties can influence how forces are managed during sprinting. During forefoot contact, forces as high as 2.2 times body weight may be generated as the foot rolls forward and transitions toward propulsion (Cavanagh & Lafortune, 1980; Stefanyshyn & Fusco, 2004). Particularly, forefoot flexibility and bending stiffness affect how these forces are distributed. Sole hardness, heel lift characteristics, and forefoot flexibility have been shown to alter sprint biomechanics by influencing joint motion and force application (Frederick, 1986). Bending stiffness affect the deformation of the shoe during ground contact and push off, thereby influencing sprint mechanics (Eshraghi & Yazdi Far, 2024). To address this, modern soccer cleats increasingly incorporate materials such as advanced polymers and carbon fiber composites in the outsole or midfoot region. These materials increase bending stiffness while maintaining relatively low mass, potentially altering force transmission during sprinting (Stefanyshyn & Fusco, 2004). Rather than directly reducing metabolic demand, design features are included to influence sprint performance by modifying mechanical behavior during forefoot loading and propulsion.
2. 3. Physiological Implications and Research Gap
Changes in footwear bending stiffness may also influence physiological responses during high intensity movements. Increased bending stiffness can affect muscle activation patterns and physiological demand during repeated sprinting and acceleration tasks (Vienneau et al., 2016). Despite growing interest in footwear stiffness and sprint biomechanics, limited research has examined how varying levels of bending stiffness in soccer cleats influence sprint performance under controlled sprint conditions. In particular, the combined effects of forefoot engagement, bending stiffness, and sprint performance remain insufficiently explored. Therefore, the purpose of this study was to investigate the influence of soccer cleat bending stiffness on sprint performance during short distance sprinting. By comparing cleats with different stiffness characteristics, this study aims to provide insight into how cleat design influences sprint mechanics and performance outcomes, thereby informing future soccer footwear design.
3. Research Method
3. 1. Participants
The study protocol and consent forms were reviewed and approved by Yonsei University Institutional Review Board (IRB) (No. 7001988-202504-HR-2685-02). A total of healthy twenty adult men in their 20s and 30s were recruited to meet the participant requirements for conducting sprinting measurements for soccer cleats. Data were collected at the Yonsei University campus soccer field from male recreational or professional soccer players. All volunteers provided written informed consent in accordance with Yonsei University’s ethics committee approval and were free from recent injuries.
Anthropometric measurements of foot morphology were collected under weight bearing conditions to reflect functional foot structure. Participants stood barefoot in a relaxed upright posture with equal weight distributed on both feet. Foot width was measured using a digital caliper as the horizontal distance between the first and fifth metatarsal heads at the widest part of the forefoot (Escalona-Marfil et al., 2014). Instep height was measured using a vertical gauge with a digital caliper, based on the concept of dorsal arch height (Escalona-Marfil et al., 2014). The vertical distance from the ground to the highest point of the dorsal foot was recorded, with measurements taken perpendicular to the ground to ensure consistency.
All participants wore a standardized size 270 mm soccer cleat, corresponding to the average men’s shoe size in Korea (approximately US 8–9.5), as prior research indicates that footwear fitting allowances are designed to accommodate foot length variations of approximately ±5 mm within a single size without substantially affecting fit or functional performance (Au et al., 2011; World Population Review, 2026).

Participant anthropometric characteristics and foot dimension measurements
3. 2. Development of Designs and Prototypes
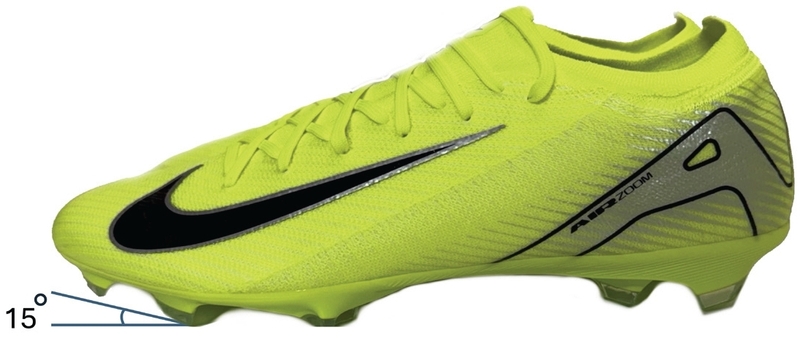
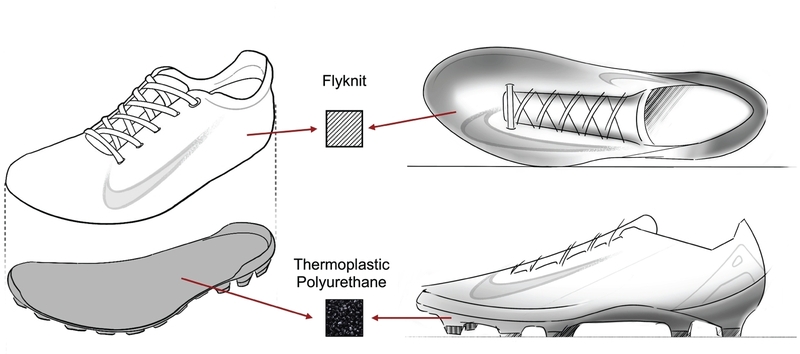
As a benchmark for comparison, the Nike Mercurial Vapor 16 AG was selected as the commercial reference model due to its reputation as a lightweight, speed-oriented soccer shoe widely used by professional athletes. The design features a 15° toe up forefoot angle, which is intended to assist forward propulsion and influence sprint performance during acceleration (Figure 2). The shoe featured a Flyknit upper for adaptive fit and flexibility, combined with a thermoplastic polyurethane (TPU) outsole engineered for durability with artificial ground (AG) studs (Figure 3).
Images of Product 1 side view (Nike Mercurial Vapor 16 AG).
Materials of Nike Mercurial Vapor 16 AG.
Two versions of custom soccer cleats were designed to optimize sprint performance, each featuring distinct upper designs aimed at enhancing foot flexibility and forefoot motion (TS Art Soccer Co., Seoul, South Korea). Both cleat models were equipped with carbon fiber plates approximately 1 mm thick, which contributed to faster and stronger push offs by enhancing energy return and minimizing energy loss during sprints (Stefanyshyn & Fusco, 2004). Both cleats also incorporated with a toe up structure angled at about 25° was added into the design to promote forefoot loading during sprint acceleration, which provides a more powerful push off for better sprint performance (Scott & Winter, 1993; Tourillon et al., 2019). This design helps runners improve sprint performance by developing running economy and biomechanics (Carranza, 2023).
The cleats were constructed with synthetic cow leather uppers to provide a secure and comfortable fit, aligning with soccer players’ preferences (Melis et al., 2016). Each pair was designed to fit a U.S. size 9 (EU size 42, length 270 mm), with size 9 chosen as it represents the average shoe size in South Korea (World Population Review, 2024). The cleats featured a low top collar integrated with a 50 mm wide movement resistance band around the ankle. The band was included to reduce slippage and maintain stability during high speed movements. The outsole was constructed from durable TPU. It featured an AG stud configuration, with 13 strategically placed studs of varying lengths, ranging from 7 mm to 16 mm. The longer 16 mm studs were integrated on the forefoot and heel areas to improve traction and grip during explosive bursts of speed, while the 7 mm studs were located on the midfoot region enhanced stability and grip during rapid directional changes and acceleration (Park, 2015). Additionally, the outsole featured curved lines that mimicked the natural motion of the foot resulting in smoother force application through the forefoot during sprints.
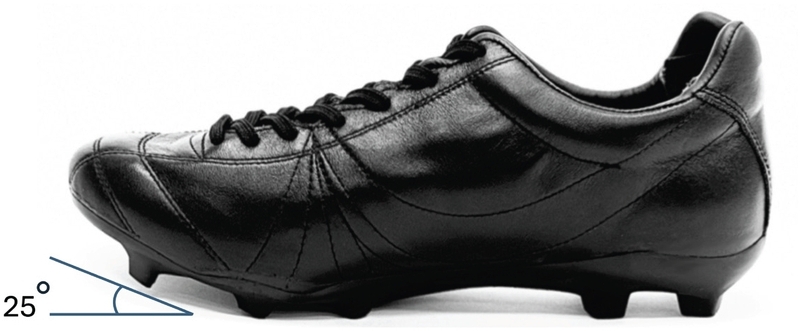
The first version of the cleats was designed with a focus on enhancing forefoot flexibility through the strategic use of seven stitching lines on the forefoot area. These stitching lines were positioned 10 mm apart in the forefoot area, allowing for greater movement of the foot during dynamic actions (Figure 4). By introducing these stitching lines, the upper material flexes naturally along with the movement of the foot and promotes smoother transitions during the propulsion phase. The design features a 25° toe up forefoot angle, which is intended to assist forward propulsion and influence sprint performance during acceleration (Figure 5).
Images of Product 2 side view (Developed Prototype Regular Cleats).
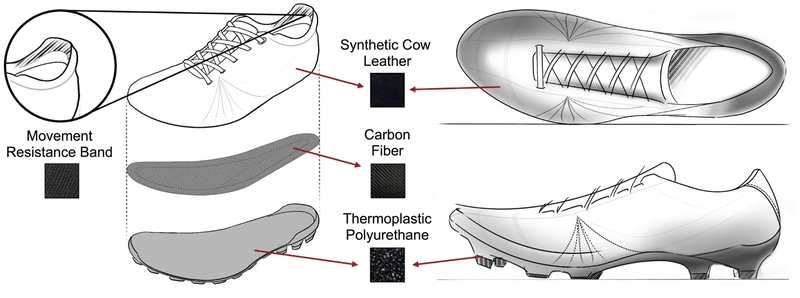
Materials of developed Prototype Regular Cleats
In contrast, the second version designed to offer a higher forefoot flexibility through the use of an elastic band across the forefoot area (Figure 6). Unlike the stitching in the Prototype Regular Cleats, the elastic band in the Prototype Band Cleats provides a high degree of stretchability. A 50 mm wide elastic band was integrated horizontally into the left and right forefoot areas, providing better flexibility and responsiveness compared to stitching lines. Adding elastic bands to the forefoot of the shoes enhances the propulsive phase of running by delivering a stronger push off (Chen et al., 2014). The elasticity of the band actively supports push offs by compressing and releasing energy as the athlete applies pressure to the forefoot. This mechanism stores energy on impact and releases it for a forward motion, enhancing propulsion and speed (Chen et al., 2014). The elastic band allows for a broader range of motion, adapting horizontal movements of the foot, which increases the forefoot’s engagement with the ground (Figure 7). This increases forefoot engagement which boosts forward force and reducing ground contact time leading to improved acceleration.
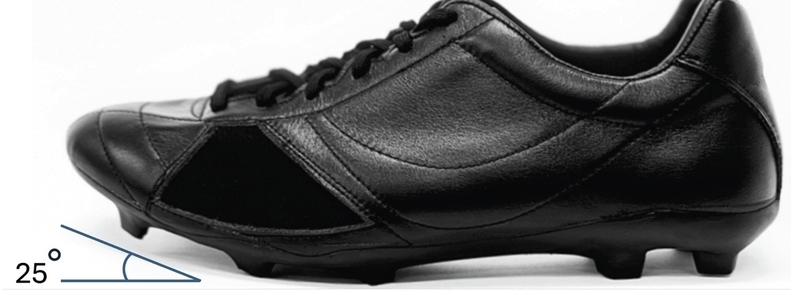
Images of Product 3 side view (Developed Prototype Band Cleats).
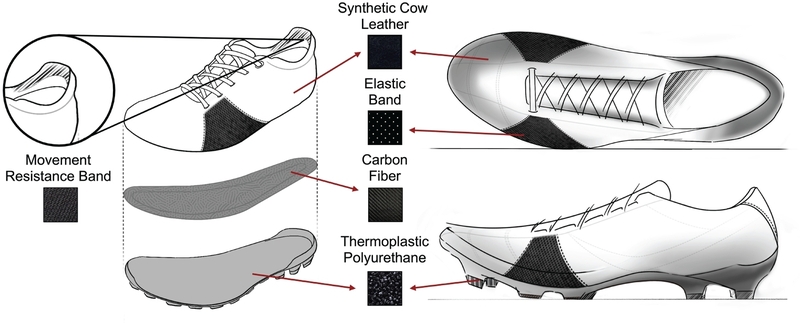
Materials of developed Prototype Band Cleats
These cleat designs aimed to improve sprint speed by optimizing both bending stiffness and natural forefoot movement. Enhanced bending stiffness allowed for a more powerful push off, increasing potential energy return while minimizing energy loss during sprints (Vienneau et al., 2016). The natural movement of the forefoot reduced ground contact time and improved energy transfer, leading to enhanced sprint performance (Stefanyshyn & Nigg, 1997). Collectively, these features were intended to enable rapid acceleration and quicker achievement of top speed, offering potential performance benefits during soccer matches.
Design specifications and structural characteristics of the commercial cleat and developed prototypes
3. 3. Procedure
All participants started with a 15 minute warm up session including 5 minutes of jogging, followed by 5 minutes of dynamic stretching for the lower limbs, and finished it with 5 minutes of straight line sprints referring from the previous research (Romero-Franco et al., 2017). After completing the warmup, all sprint trials were conducted on an outdoor artificial grass (AG) field (Figure 8). The surface was dry and in good condition at the time of testing. Temperature was maintained at approximately 20–24 °C, and environmental conditions were kept consistent across all testing sessions. To minimize daily variations in sprinting performance, each participant was consistently tested while wearing soccer cleats on the same synthetic grass field at approximately the same time of day (Carter et al., 2002). There were 7 minute rest intervals between trials.
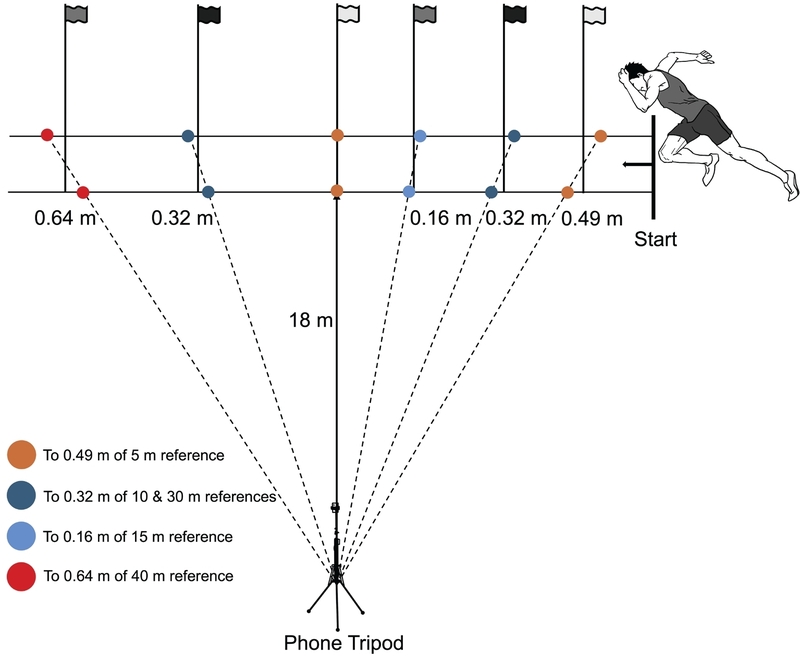
MySprint validation protocol (Romero–Franco et al., 2017, recreated by the authors)(The reference system used flags to indicate the distances)
A total of the three soccer cleats were evaluated. The first footwear was the Nike soccer cleats called the Nike Mercurial Vapor 16 AG (Nike, Inc., Beaverton, OR). The other was the biomechanically design of the custom soccer cleats with stitching on the forefoot area. Lastly, the custom soccer cleats with elastic band on the forefoot area. Each participant completed three trials with three different types of footwear, resulting in a total of six trials per person. All trials were recorded using an iPhone 15 Pro through MySprint app. The starting position was a crouched stance while having the right hand placed on the track. The starting position was fixed as the placement of the participants’ right thumb left to the ground which was detected visually with MySprint. The timing system had a resolution of 0.01 seconds.
In order to accurately measure split times during the 40 meter trials, a total of seven pairs of timing flags were strategically placed at distances: 0, 5, 10, 15, 20, 30, and 40 meters. The MySprint app was installed on an iPhone 15 Pro running iOS 17.5.1 and tested with the iPhone’s built in Macro video recording including 240 fps high speed camera at 1080p resolution. It was analyzed with multiple split times by slow motion recording with timestamps flags at the start and through each point where the athlete crossed six designated flags. In order to capture the entire sprint, the iPhone 15 Pro was mounted on a tripod positioned at the 20 meter marker and 18 meters away from the track. The video angle was adjusted to the marker positions so that the participants’ hips crossed each flag at the designated distances of 5, 10, 15, 20, 30 and 40 meters. The first frame was selected and aligned with the starting position when the participant’s right thumb was still in contact with the ground. Furthermore, frames were selected when the participant’s pelvis was aligned with each of the six markers. The MySprint app then calculated each split time in milliseconds. The recorded sprint times were analyzed using repeated measures to evaluate whether the biomechanical design of the custom soccer cleats enhanced sprint performance.
3. 4. VO₂ and HR Measurement
To accurately measure VO₂ across a wide range of intensities from rest to maximal exercise, the VO₂ Master Pro (VO₂ Master Health Sensors Inc., Vernon, CA) was used. Heart rate (HR) was continuously monitored by Polar H10 Band (Polar Electro Oy, Kempele, Finland). First, the gas was calibrated to the manufacturer’s settings. When the VO₂ Master was turned on it auto calibrated to the ambient air for O₂ concentrations, ambient temperature, humidity and barometric pressure. Upon activation, the VO₂ Master automatically calibrated to the ambient air, adjusting for O₂ concentration, temperature, humidity, and barometric pressure (Montoye et al., 2020). Following gas calibration, the VO₂ Master was fitted to the participants, who were then instructed to take 10-15 deep breaths to calibrate the flowmeter (Montoye et al., 2020). During the testing protocol, the device performed auto calibrations at the 5 minutes and 25 minutes marks, each lasting approximately 30 to 45 seconds (Montoye et al., 2020). Furthermore, the heart rate sensor band was positioned around the participant’s upper torso, below the chest (Figure 9). These protocols were based on established research, ensuring that the device remained accurate throughout the testing process.
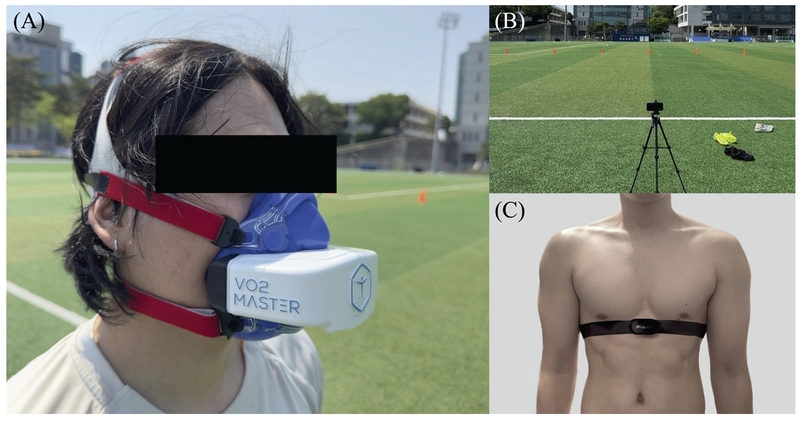
Representative images of: (A) VO₂ Master; (B) Yonsei University soccer field; (C) Polar H10 band.
3. 5. Experiment Procedure
To maintain consistency across all participants and trials, a standardized experimental protocol was followed. The procedure was divided into four parts, each structured to ensure that cleat conditions were tested under similar physical and physiological states. Participants began by wearing the cleats, which took about 1 minute. After putting on the cleats, they completed 5 minutes of lower body stretching to activate the key muscle groups. This was followed by another 5 minutes of light jogging and sprint drills to adjust to the cleat fit and surface conditions. Once participants felt comfortable, they started a 5 minutes running session to raise their body temperature and prepare for maximal effort. After this warm up, the VO2 and HR measurement devices were attached. This setup took 5 minutes, allowing time to confirm sensor placement and calibrate the devices. Following sensor attachment, participants completed their first 40 meter sprint trial with these cleats. The sprint was recorded using the MySprint app for split time analysis. Once the sprint was finished, they took a 7 minutes rest to recover before attempting the second sprint trial. The second run was also recorded in the same manner.
Before testing, a 7 minutes recovery period was given to allow cardiovascular and muscular systems to return to baseline. Once rest was complete, the cleats were worn for 1 minute, ensuring proper fit and comfort. After that, participants completed their first sprint trial using these cleats. The same MySprint protocol and video analysis setup was used to collect data. After the first run, another 7 minutes rest was given, followed by the second sprint trial in this cleat. Participants were monitored to ensure they did not experience discomfort, fatigue, or performance decline between the two runs. Cleats were also worn after a short 1 minute fitting period. Once properly fitted, participants immediately completed their first 40 meter sprint run. Following this run, they again rested for 7 minutes before starting the second sprint trial with the same cleats. After completing this final run, the entire test session ended for that participant.
The purpose of keeping each phase uniform was to ensure that all participants had similar physical readiness when switching cleats. The 7 minutes rest intervals between trials and cleat conditions were intended to reset cardiovascular and muscular fatigue levels. This helped avoid skewed results that could occur from accumulated exhaustion. The recovery period was also long enough to allow phosphocreatine stores to replenish in the muscles, which are crucial for short, intense efforts like sprinting. One key consideration was cleat fitting time. Each fitting was done in 1 minute. Participants were asked to confirm if the fit was secure before starting sprints. The lacing, foot position, and comfort were adjusted as needed. Small adjustments were allowed, but participants were not allowed to move or warm up again after the fitting. The short fitting window ensured that the overall test session remained within a reasonable time limit, while still allowing enough preparation to perform at full capacity.
All participants completed six total sprint trials and two with each cleat type. This allowed for a balanced dataset and reduced the chance of outliers due to occasional missteps or external distractions. Every sprint was recorded using the same high speed video setup with the MySprint app, which enabled frame by frame analysis of split times. The high speed camera helped capture precise moments when the participant’s hip crossed each timing marker, ensuring accuracy in sprint timing and distance splits. The entire protocol took about 60 to 75 minutes per participant. This included warm up, all sprint trials, rest periods, and sensor calibration. Despite the intensity of the task, all 20 participants completed the entire session without injury or early withdrawal. Careful monitoring during each rest period helped confirm that participants were fit to continue. All trials were conducted on the same synthetic grass surface under stable weather conditions to keep environmental variables constant. This detailed and repetitive structure gave the study strong internal control. By standardizing rest periods, sensor setups, sprint repetitions, and cleat transitions, the effect of the cleat design could be isolated more clearly. The performance differences observed later in the study were less likely due to random fatigue or field variation and more likely linked to actual changes in sprint output caused by the cleats.
The order of footwear conditions was randomized across participants to minimize potential order effects. Each condition was tested twice, with sufficient rest intervals provided between trials. By using two sprint trials per cleat and separating them with meaningful rest, the study also allowed for more reliable averaging of data. If a participant ran slower in one trial but faster in the next, the data could reflect their mean performance rather than being skewed by a single fast or slow effort. This approach aligns with good practices in sports performance testing and added more confidence to the sprint timing analysis. The experimental protocol was not only detailed but also practical for soccer specific testing. The use of cleat changes, high speed running, and consistent rest mirrors real match scenarios where players repeatedly sprint with short rest periods. The inclusion of physiological sensors like VO₂ and HR also enabled the study to go beyond just sprint time and assess internal effort. This dual approach gave the research more depth and helped link design features with both performance and metabolic response. In summary, the testing procedure was designed to reflect real gameplay demands while also offering control and repeatability. The sequence of sprints, rest periods, and cleat changes gave each athlete a fair opportunity to perform and allowed accurate comparisons of cleat designs under equal physical conditions.
3. 6. Statistical analysis
Statistical analyses and graph generation were conducted using GraphPad Prism version 10 (GraphPad Software, San Diego, CA) and jamovi version 2.6 (The jamovi project, Sydney, Australia). Data are presented as mean ± standard deviation (SD). Because all participants completed trials under all three footwear conditions, a repeated measures one-way ANOVA was used to evaluate differences among the three conditions (Product 1, Product 2, and Product 3). Mauchly’s test was performed to assess the assumption of sphericity. When sphericity was violated (p < .05), Greenhouse–Geisser corrections were applied; otherwise, uncorrected results are reported. Post hoc pairwise comparisons were performed using Bonferroni adjustment. Statistical significance was set at p < .05.
4. Result and Discussion
4. 1. Design Development and Prototyping
This study investigated the influence of specific soccer cleat design elements on sprint performance. Based on sprint biomechanics and forefoot dominant running mechanics, key structural features were defined as independent design variables across the three footwear conditions. These variables included toe up angle, arch height, upper material, forefoot flexibility mechanism, outsole material, and stud configuration. Two custom soccer cleat prototypes were developed to modify forefoot related design variables. Both designs incorporated an elevated arch height combined with a toe up forefoot structure to promote forefoot loading and influence propulsion characteristics during sprint acceleration. Both cleats had carbon fiber in them to make them flexible and light yet strong. Carbon fiber is known for its high strength to weight ratio, durable yet flexible for dynamic movements. This was important to get the balance between stiffness for potential energy return and flexibility for comfort. Also the outer surface material of the custom soccer cleats was leather. Cow leather was one of the players’ preference after they evaluated the effect of the outer surface material of soccer shoes on fit perception (Melis et al., 2016). Leather was one of the common material used in soccer cleats was praised for its comfort and the feature of stretch to mold into the foot’s shape (Torp, 2024). Choosing the right materials for functionality and comfort was the key to improve sprinting.
The first cleat design was focused on balance between flexibility and support by having stitching in the forefoot area. Stitching was used across the forefoot region to provide flexibility. The stitching method provides controlled flexibility to ensure the cleats will hold its shape and provide support during high intensity movements. This design provided a stable yet flexible platform for sprinting motions. The controlled flexibility helps to keep the foot aligned, reduce the risk of injury and overall stability during sprints. The second cleat design was focused on highest level of elastic flexibility by having elastic bands in the forefoot area. Elastic bands were placed across the forefoot region to provide more flexibility. These bands allow more stretch and recoil during foot strike, which may contribute to improved energy return and release. The elasticity ensures the cleats to adapt to the foot’s movement to provide a snug fit for comfort and performance. The elastic bands allow the foot to move more naturally to transition smoother through the gait cycle. In the end the design was focused on quick explosive movements as it provides the flexibility to optimize sprint performance without compromising support. In summary, both soccer cleat designs had ergonomic features to improve sprint performance by using the forefoot. The carbon fiber elements ensured both designs have the flexibility and support. The first design with stitching has mid level flexibility balancing support and adaptability. The second design with elastic bands has high elastic flexibility for explosive movements.
4. 2. Demographic Characteristics
This study included 20 male participants with a mean age of 27.4 years (SD = 4.7) (Table 3). The average height was 175.7 cm (SD = 4.0), and the mean body weight was 75.3 kg (SD = 6.7). The average Body Mass Index (BMI) of the participants was 22.54 (SD = 2.72). It was calculated by dividing weight in kilograms by the square of height in meters. This fell within the normal weight range defined by the World Health Organization (WHO) (Wu et al., 2024). Among the 20 participants, their soccer experience ranged from an amateur level or even college professional level.
Physical characteristic data for the participants.
The mean and standard deviation (SD) volume of oxygen consumption (VO₂), heart rate (HR), and sprint time recorded under three different cleat conditions (Table 4). Product 1 showed an average VO₂ of 9.54 ± 3.46 ml/kg/min, an average HR of 110.2 ± 16.05 bpm, and an average sprint time of 5.053 ± 0.20 s. Product 2 recorded the lowest average VO₂ of 8.30 ± 2.35 ml/kg/min and an average HR of 109.90 ± 14.90 bpm, but showed a slightly slower average sprint time of 5.189 ± 0.23 s. Product 3 displayed the highest average VO₂ of 10.54 ± 2.64 ml/kg/min and an average HR of 111.35 ± 14.58 bpm, achieving the fastest average sprint time of 4.991 ± 0.22 s. Overall, while physiological responses (VO₂ and HR) were slightly elevated in Product 3, it was also associated with improved sprint performance.
Comparison of VO₂, Heart Rate, and Sprint Time values for each cleat type: (Product 1) Nike Mercurial Vapor 16 AG, (Product 2) Prototype Regular Cleats, and (Product 3) Prototype Band Cleats.
Individual VO₂ (ml/kg/min) consumption values for each footwear condition
Individual heart rate (bpm) values for each footwear condition
Individual 40 m sprint time (s) for each footwear condition
Repeated-measures ANOVA summary for VO₂.
Repeated-measures ANOVA summary for Heart Rate.
Repeated-measures ANOVA summary for Speed.
4. 3. Oxygen Consumption (VO₂)
The average VO₂ uptake during the 40 m sprint trials was compared among the three cleat conditions to examine physiological response during sprint acceleration (Figure 10). Across 20 participants, a repeated-measures one-way ANOVA showed that mean VO₂ values differed significantly among cleat types. Post hoc comparisons indicated that Product 3 produced significantly higher VO₂ than Product 2 (p < .01), whereas no significant differences were observed between Product 1 and Product 3. The mean VO₂ values were 9.54 ± 3.46 ml/kg/min for Product 1, 8.30 ± 2.35 ml/kg/min for Product 2, and 10.54 ± 2.64 ml/kg/min for Product 3. Compared with Product 2 and Product 1, Product 3 demonstrated approximately 27.0% and 10.5% higher VO₂ values, respectively.
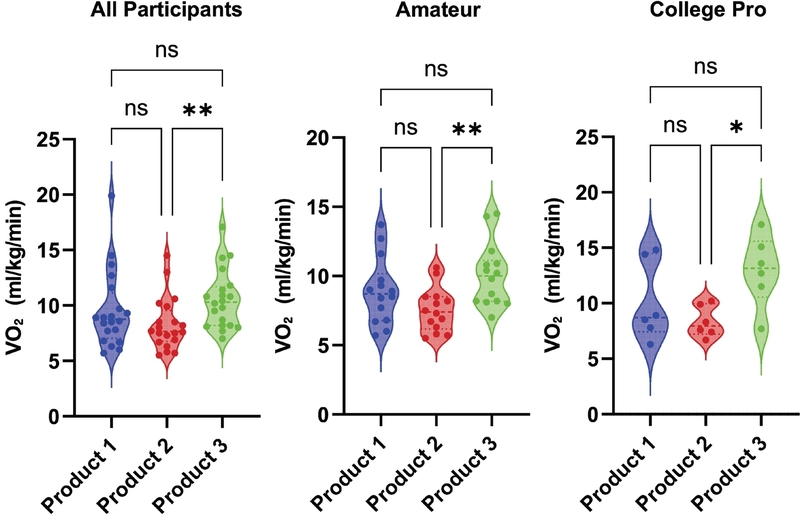
Comparison of VO₂ across cleat types for all participant groups. Violin plots represent the distribution of individual VO₂ values, dots indicate individual participants, and error bars represent the mean ± SD. From left to right: All participants, amateur players, and college pro players.
Product 3 showed significantly higher VO₂ than Product 2 (p < .01), whereas no significant differences were observed between Product 1 and Product 2 or between Product 1 and Product 3. In the college pro group, Product 3 demonstrated significantly higher VO₂ than Product 2 (p < .05), whereas no significant differences were observed between Product 1 and Product 2 or between Product 1 and Product 3.
At high speeds, the body’s oxygen use approaches or even reaches VO₂max, which represents the maximum amount of oxygen an individual can utilize during exercise (Bassett & Howley, 2000). Individuals with higher VO₂max values can sustain faster running speeds because they are able to deliver and utilize more oxygen to meet the increased metabolic demands of exercise (Joyner & Coyle, 2008). These findings suggest that the higher VO₂ observed in Product 3 reflects greater physiological demand associated with higher-intensity sprinting rather than improved metabolic efficiency. The professionals’ consistent sprinting technique may have minimized intertrial variability, allowing the biomechanical effects of Product 3’s elastic forefoot band and toe-up structure to be more consistently expressed during sprint performance.
4. 4. Heart Rate (HR)
HR responses paralleled the VO₂ results but did not reach statistical significance (Figure 11). Across the entire sample, no significant differences were observed among the three cleat conditions. The mean HR values were 110.2 ± 16.05 bpm for Product 1, 109.90 ± 14.90 bpm for Product 2, and 111.35 ± 14.58 bpm for Product 3. The approximately 1–1.3% higher mean HR observed in Product 3 was small and remained statistically non-significant (p > .05) across all participant groups. Although the differences were not statistically significant, the HR pattern was consistent with the VO₂ findings, with Product 3 exhibiting the highest mean HR across the three footwear conditions. Furthermore, higher running intensity is generally accompanied by an increase in heart rate (Jang et al., 2016). These findings suggest that the slightly higher HR observed in Product 3 may reflect greater physiological demand during sprinting rather than indicating improved physiological efficiency.
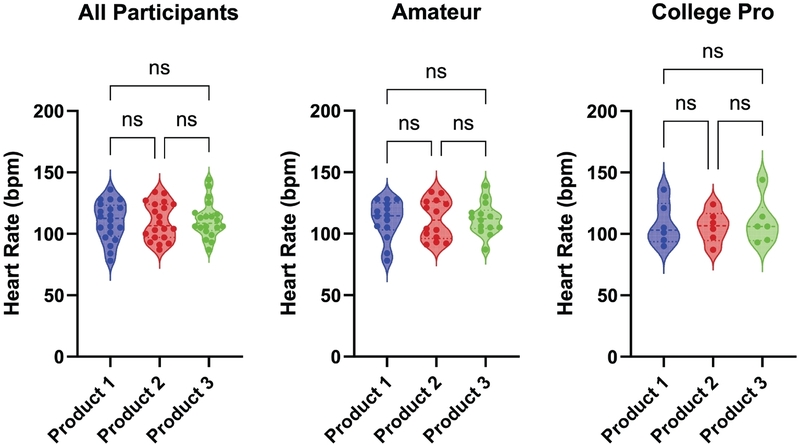
Comparison of Heart Rate (Mean ± SD) across cleat types for all participant groups. Violin plots represent the distribution of individual Heart Rate values, dots indicate individual participants, and error bars represent the mean ± SD. From left to right: All participants, amateur players, and college pro players.
4. 5. Sprint Performance
Sprint time over 40 meters was used as the primary indicator of sprint performance (Figure 12). Statistically significant differences were observed among the three cleat conditions. Across all 20 participants, Product 3 achieved the fastest mean sprint time (4.991 ± 0.22 s), which was significantly faster than Product 2 (5.189 ± 0.23 s, p < .05). Although Product 3 also demonstrated a faster mean sprint time than Product 1 (5.053 ± 0.20 s), this difference did not reach statistical significance (p > .05). The observed reductions correspond to an approximate 3.82% improvement relative to Product 2 and a 1.23% improvement relative to Product 1, indicating enhanced acceleration performance with Product 3.
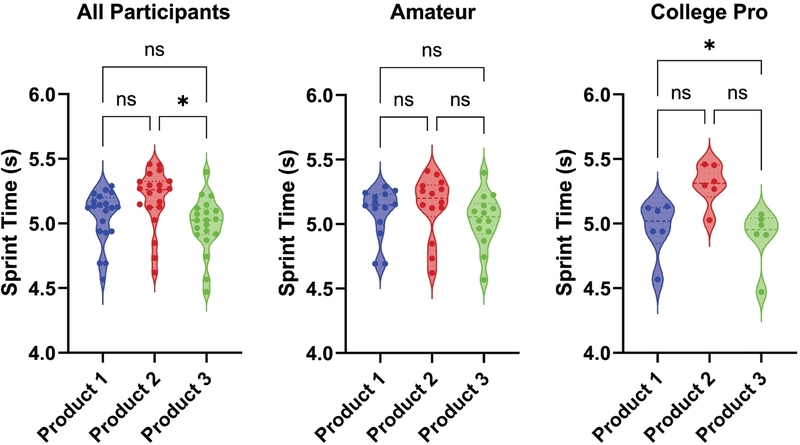
Comparison of 40 m Sprint Time (Mean ± SD) across cleat types for all participant groups. Violin plots represent the distribution of individual Sprint Time values, dots indicate individual participants, and error bars represent the mean ± SD. From left to right: All participants, amateur players, and college pro players.
When considering all participants, Product 3 demonstrated statistical significance in sprint performance compared with Product 2. Among amateur players, no significant differences in sprint time were observed. This finding may reflect greater interindividual variability in running technique and acceleration control within this group. In contrast, a distinct pattern emerged among college pro players. Product 3 achieved the fastest sprint times and was significantly faster than Product 1 (p < .05), whereas no significant differences were found between Product 1 and Product 2 or between Product 2 and Product 3. These findings suggest that athletes with higher technical proficiency and more consistent sprint mechanics may be better able to utilize the biomechanical characteristics of the Prototype Band Cleats. In particular, the elastic forefoot band and carbon fiber plate may improve force transmission, which may contribute to improved energy return during the drive phase of sprint acceleration. These design features may also contribute to reduced ground contact time and enhanced horizontal force production. Rapid acceleration influences not only sprint performance but also key match situations such as securing first ball contact, creating separation from opponents, and regaining possession (Hennig & Sterzing, 2010). Therefore, even small improvements in sprint performance may provide a meaningful competitive advantage in elite-level soccer.
4. 6. Discussion: Design Implications for Sprint Oriented Soccer Cleats
This study examined how specific soccer cleat design elements influence sprint performance, with particular emphasis on forefoot compliance. The findings indicate that differences in forefoot flexibility strategies led to differences in sprint outcomes, highlighting the importance of design elements. Product 2 (Prototype Regular Cleats) demonstrated slower sprint performance than the commercial reference cleat (Product 1). One possible explanation is that the stitching based forefoot structure provided moderate but limited flexibility, which may not have been sufficient to enhance forefoot mechanics and recoil during the propulsion phase of sprinting. At the same time, this added structure may have increased overall stiffness or mass without delivering a clear biomechanical benefit during the very short ground contact times characteristic of sprint acceleration. As a result, Product 2 may not have effectively supported rapid force application during push off, leading to reduced sprint performance despite its intentional design.
In contrast, Product 3 (Prototype Band Cleats) demonstrated the fastest sprint times, particularly among college level professional players. The elastic band based forefoot design likely provided greater dynamic compliance, allowing more effective forefoot compliance and recovery during ground contact. This increased adaptability may have provided quicker transitions through the propulsion phase, contributing to reduced ground contact time and enhanced horizontal force application. Notably, both prototypes incorporated carbon fiber and a forefoot focused stud configuration. The longer studs positioned in the forefoot region likely improved traction during initial contact and push off, encouraging earlier and more stable forefoot engagement during acceleration. However, the performance of Product 3 suggests that bending stiffness alone was insufficient to enhance sprint performance. Rather, the interaction between forefoot flexibility, bending stiffness, and stud configuration appears to be critical for optimizing sprint acceleration. Instead, the interaction between bending stiffness and forefoot flexibility appears to be critical. In Product 3, the elastic forefoot structure may have complemented the carbon fiber reinforcement by allowing controlled compliance followed by rapid recoil, whereas Product 2 lacked sufficient dynamic flexibility to achieve a similar effect.
The physiological responses further support this interpretation. Although Product 3 was associated with higher VO₂ values, oxygen consumption during short distance sprinting should be interpreted as reflecting physiological response and metabolic demand during sprint activity. Increased VO₂ likely reflects greater muscle recruitment and higher mechanical output required to achieve faster sprint speeds, rather than reduced energetic cost. Therefore, the increased VO₂ observed in Product 3 is best interpreted as evidence of increased sprint intensity.
Taken together, these findings provide several design implications for sprint oriented soccer cleats. First, forefoot flexibility should be tuned rather than minimized or maximized; designs that allow forefoot compliance and recovery appear more effective. Second, bending stiffness should not be considered in isolation. Its interaction with forefoot compliance plays a decisive role in sprint performance. Third, elastic forefoot structures may be more effective than stitching based segmentation in supporting explosive sprint acceleration. Finally, the more pronounced performance benefits observed in skilled players suggest that advanced athletes may be better able to exploit biomechanical advantages provided by footwear design.
5. Conclusion
From a design perspective, forefoot flexibility should be carefully tuned rather than minimized or maximized. Elastic forefoot structures that allow controlled compliance followed by rapid recovery may be more effective than rigid or segmented constructions in supporting explosive sprint acceleration. Furthermore, the more pronounced performance benefits observed among skilled players indicate that advanced athletes may be better able to exploit biomechanical advantages provided by footwear design.
Although, the sample size was relatively small, and biomechanical measurements such as ground reaction forces, plantar pressure distribution, joint kinematics, and muscle activation patterns were not directly assessed. Future studies can include larger samples and incorporate additional biomechanical measurements, such as ground reaction forces and plantar pressure distribution, as well as motion capture and electromyography (EMG), to better understand the mechanisms underlying the observed performance differences. Despite these limitations, the present findings demonstrate that targeted forefoot design strategies can meaningfully influence sprint performance in soccer. By emphasizing the interaction between forefoot compliance, bending stiffness, and stud configuration, this study provides practical guidance for the development of next generation sprint oriented soccer cleats.
Notes
Copyright : This is an Open Access article distributed under the terms of the Creative Commons Attribution Non-Commercial License (http://creativecommons.org/licenses/by-nc/3.0/), which permits unrestricted educational and non-commercial use, provided the original work is properly cited.
References
-
Au, E. Y., Goonetilleke, R. S., Witana, C. P., & Xiong, S. (2011). A methodology for determining the allowances for fitting footwear. International Journal of Human Factors Modelling and Simulation, 2(4), 341-366.
[https://doi.org/10.1504/IJHFMS.2011.045003]

-
Andrzejewski, M., Chmura, J., Pluta, B., Strzelczyk, R., & Kasprzak, A. (2013). Analysis of sprinting activities of professional soccer players. Journal of Strength and Conditioning Research, 27(8), 2134-2140.
[https://doi.org/10.1519/JSC.0b013e318279423e]
-
Bassett, D. R., & Howley, E. T. (2000). Limiting factors for maximum oxygen uptake and determinants of endurance performance. Medicine and Science in Sports and Exercise, 32(1), 70-84.
[https://doi.org/10.1097/00005768-200001000-00012]
-
Bradley, P. S., Di Mascio, M., Peart, D., Olsen, P., & Sheldon, B. (2010). High-intensity activity profiles of elite soccer players at different performance levels. Journal of Strength and Conditioning Research, 24(9), 2343-2351.
[https://doi.org/10.1519/JSC.0b013e3181aeb1b3]
-
Carling, C., Le Gall, F., & Dupont, G. (2012). Analysis of repeated high-intensity running performance in professional soccer. Journal of Sports Sciences, 30(4), 325-336.
[https://doi.org/10.1080/02640414.2011.652655]
-
Carranza, V. R. (2023). Running footwear matters: decoding the influence of running shoe characteristics on physiology, biomechanics and running performance (PhD Academy Award). British Journal of Sports Medicine, 57(24), 1581-1582.
[https://doi.org/10.1136/bjsports-2023-107452]
-
Carter, H., Jones, A. M., Maxwell, N. S. and Doust, J. H. (2002). The effect of interdian and diurnal variation on oxygen uptake kinetics during treadmill running. Journal of Sports Sciences, 20(11), 901-909.
[https://doi.org/10.1080/026404102320761796]
-
Cavanagh, P. R., & Lafortune, M. A. (1980). Ground reaction forces in distance running. Journal of Biomechanics, 13(5), 397-406.
[https://doi.org/10.1016/0021-9290(80)90033-0]
-
Chen, C. H., Tu, K. H., Liu, C., & Shiang, T. Y. (2014). Effects of forefoot bending elasticity of running shoes on gait and running performance. Human Movement Science, 38, 163-172.
[https://doi.org/10.1016/j.humov.2014.10.002]
-
Cometti, G., Maffiuletti, N. A., Pousson, M., Chatard, J. C., & Maffulli, N. (2001). Isokinetic strength and anaerobic power of elite, subelite and amateur French soccer players. International Journal of Sports Medicine, 22(1), 45-51.
[https://doi.org/10.1055/s-2001-11331]
-
Datson, N., Drust, B., Weston, M., Jarman, I. H., Lisboa, P. J., & Gregson, W. (2017). Match physical performance of elite female soccer players during international competition. Journal of Strength and Conditioning Research, 31(9), 2379-2387.
[https://doi.org/10.1519/JSC.0000000000001575]
-
Di Salvo, V., Baron, R., Tschan, H., Montero, F.C., Bachl, N., & Pigozzi, F. (2007). Performance characteristics according to playing position in elite soccer. International Journal of Sports Medicine, 28(3), 222-227.
[https://doi.org/10.1055/s-2006-924294]
- Dri, A. (2024). What to look for when choosing your footy boots. Watsonia Podiatry. https://watsoniapodiatry.com.au/what-to-look-for-when-choosing-your-footy-boots (accessed 3 June 2024).
-
Ericsson, K. A. (2020). Towards a science of the acquisition of expert performance in sports: clarifying the differences between deliberate practice and other types of practice. Journal of Sports Sciences, 38(2), 159-176.
[https://doi.org/10.1080/02640414.2019.1688618]
-
Escalona-Marfil, C., McPoil, T. G., Mellor, R., & Vicenzino, B. (2014). A radiographic and anthropometric study of the effect of a contoured sandal and foot orthosis on supporting the medial longitudinal arch. Journal of Foot and Ankle Research, 7(1), 38.
[https://doi.org/10.1186/s13047-014-0038-5]
-
Eshraghi, S., & Yazdi Far, M. (2024). Footwear bending stiffness measurement methods: a review. Footwear Science, 16(1), 43-53.
[https://doi.org/10.1080/19424280.2023.2267530]
-
Frederick, E. C. (1986). Kinematically mediated effects of sport shoe design: a review. Journal of Sports Sciences, 4(3), 169-184.
[https://doi.org/10.1080/02640418608732116]
-
Hennig, E. M., & Sterzing, T. (2010). The influence of soccer shoe design on playing performance: a series of biomechanical studies. Footwear Science, 2(1), 3-11.
[https://doi.org/10.1080/19424281003691999]
-
Jang, D. G., Ko, B. H., Sunoo, S., Nam, S. S., Park, H. Y., & Bae, S. K. (2016, August). A preliminary study of a running speed based heart rate prediction during an incremental treadmill exercise. Proceedings of the 38th Annual International Conference of the IEEE Engineering in Medicine and Biology Society (EMBC), pp. 5323-5326.
[https://doi.org/10.1109/EMBC.2016.7591929]
-
Joyner, M. J., & Coyle, E. F. (2008). Endurance exercise performance: the physiology of champions, Journal of Physiology, 586(1), 35-44.
[https://doi.org/10.1113/jphysiol.2007.143834]
- Lill, A. (2021). How to choose the perfect football boots. Ultra Football. https://www.ultrafootball.com/blogs/ultra-mag/how-to-choose-the-perfect-football-boots.
-
Macnamara, B. N., Hambrick, D. Z., & Oswald, F.L. (2014). Deliberate practice and performance in music, games, sports, education, and professions: a meta-analysis. Psychological Science, 25(8), 1608-1618.
[https://doi.org/10.1177/0956797614535810]
-
Martínez-Lagunas, V., Niessen, M., & Hartmann, U. (2014). Women's football: player characteristics and demands of the game. Journal of Sport and Health Science, 3(4), 258-272.
[https://doi.org/10.1016/j.jshs.2014.10.001]
-
McPoil, T. G. (2000). Athletic footwear: design, performance and selection issues. Journal of Science and Medicine in Sport, 3(3), 260-267.
[https://doi.org/10.1016/S1440-2440(00)80035-3]
-
Melis, J. O., Quesada, J. P., Lucas-Cuevas, A. G., García, J. G., & Palau, S. P. (2016). Soccer players' fitting perception of different upper boot materials. Applied Ergonomics, 55, 27-32.
[https://doi.org/10.1016/j.apergo.2016.01.005]
-
Montoye, A. H., D VONDRASEK, J. O. S. E. P. H., & JAMES B HANCOCK, I. I. (2020). Validity and reliability of the VO2 master pro for oxygen consumption and ventilation assessment. International Journal of Exercise Science, 13(4), 1382.
[https://doi.org/10.70252/THJT1177]
-
Okholm Kryger, K., Mutamba, K., Mitchell, S., Miller, S. C., & Forrester, S. (2021). Physical performance and perception of foot discomfort during a soccer-specific match simulation: a comparison of football boots. Journal of Sports Sciences, 39(9), 1046-1054.
[https://doi.org/10.1080/02640414.2020.1856461]
- Park, J. (2015). Sports gear: soccer shoes, 150g ultra-light··· Ronaldo has long studs, Neymar has short studs. Munhwa Ilbo. https://munhwa.com/news/view.html?no=2015061001033439274001.
- Pignataro, J. (2024). Rocking leather on the field: A how-to guide for leather soccer cleats. U90 Soccer. https://u90soccer.com/blogs/learn/leather-soccer-cleats.
-
Rampinini, E., Bishop, D., Marcora, S. M., Bravo, D. F., Sassi, R., & Impellizzeri, F. M. (2007a),.Validity of simple field tests as indicators of match-related physical performance in top-level professional soccer players. International Journal of Sports Medicine, 28(3), 228-235.
[https://doi.org/10.1055/s-2006-924340]
-
Rampinini, E., Coutts, A. J., Castagna, C., Sassi, R., & Impellizzeri, F. M. (2007b). Variation in top level soccer match performance, International Journal of Sports Medicine, 28(12), 1018-1024.
[https://doi.org/10.1055/s-2007-965158]
-
Romero-Franco, N., Jiménez-Reyes, P., Castaño-Zambudio, A., Capelo-Ramírez, F., Rodríguez-Juan, J.J., González-Hernández, J., & Balsalobre-Fernández, C. (2017). Sprint performance and mechanical outputs computed with an iPhone app: comparison with existing reference methods. European Journal of Sport Science, 17(4), 386-392.
[https://doi.org/10.1080/17461391.2016.1249031]
-
Scott, S. H., & Winter, D. A. (1993). Biomechanical model of the human foot: kinematics and kinetics during the stance phase of walking. Journal of Biomechanics, 26(9), 1091-1104..
[https://doi.org/10.1016/S0021-9290(05)80008-9]
-
Stefanyshyn, D., & Fusco, C. (2004). Athletics: increased shoe bending stiffness increases sprint performance. Sports Biomechanics, 3(1), 55-66.
[https://doi.org/10.1080/14763140408522830]
-
Stefanyshyn, D. J., & Nigg, B. M. (1997). Mechanical energy contribution of the metatarsophalangeal joint to running and sprinting. Journal of Biomechanics, 30, (11-12), 1081-1085.
[https://doi.org/10.1016/S0021-9290(97)00081-X]
- Sterzing, T. (2016). Soccer boots and playing surfaces. Soccer science, 339, 179-202.
-
Stølen, T., Chamari, K., Castagna, C., & Wisløff, U. (2005), Physiology of soccer: an update. Sports Medicine, 35, 501-536.
[https://doi.org/10.2165/00007256-200535060-00004]
-
Tourillon, R., Gojanovic, B., & Fourchet, F. (2019). How to evaluate and improve foot strength in athletes: an update. Frontiers in Sports and Active Living, 1, 485486.
[https://doi.org/10.3389/fspor.2019.00046]
-
Vienneau, J., Nigg, S. R., Tomaras, E. K., Enders, H., & Nigg, B. M. (2016). Soccer shoe bending stiffness significantly alters game-specific physiology in a 25-minute continuous field-based protocol. Footwear Science, 8(2), 83-90.
[https://doi.org/10.1080/19424280.2016.1147616]
-
Vigne, G., Gaudino, C., Rogowski, I., Alloatti, G., & Hautier, C. (2010). Activity profile in elite Italian soccer team. International Journal of Sports Medicine, 31(5), 304-310.
[https://doi.org/10.1055/s-0030-1248320]
- World Population Review. (2026). Shoe size by country. https://worldpopulationreview.com/country-rankings/shoe-size-by-country.
- World Population Review. (2024). Shoe size by country. https://worldpopulationreview.com/country-rankings/shoe-size-by-country (accessed 3 June 2024).
-
Wu, Y., Li, D., & Vermund, S. H. (2024), Advantages and limitations of the body mass index (BMI) to assess adult obesity. International Journal of Environmental Research and Public Health, 21(6), 757.
[https://doi.org/10.3390/ijerph21060757]