The Factors Influencing User Experience of The Palace Museum Mobile Guide System : The Technology Acceptance Model
Abstract
Background Enhancing user experience (UX) and encouraging the usage of mobile museum guide systems (MMGS) has become a crucial task as museum digital transformation continues to progress. To shed light on how UX influences user behavior through perceptual pathways and to provide effective optimization solutions, this study investigates the influence mechanism of UX variables on usage intention (UI) in MMGS.
Methods The study begins by conducting a literature review to integrate established constructs from the technology acceptance model (TAM) with key UX factors to develop a UX impact model comprising fifteen hypothesized paths. Drawing on 523 valid responses collected through a structured questionnaire, structural equation modeling (SEM) was used to test the relationships among model variables and to reveal how UX factors indirectly affect UI through multiple mediators.
Results Aesthetic experience, functional experience, and emotional experience significantly and positively influence perceived ease of use, perceived usefulness, and perceived enjoyment, respectively. These perceptual variables serve as mediators between UX and UI, indicating that UX can influence behavioral intention indirectly through perception-based pathways. The study extends the theoretical applicability of TAM within a cultural context and offers a theoretical foundation for the development and enhancement of MMGS.
Conclusions This study elucidates the mechanism by which UX factors shape UI through perceptual mediation. It is recommended that museums adopt an integrated approach to UX optimization when designing MMGS, with particular emphasis on aesthetic design, system functionality, and emotional engagement, in order to enhance the quality of digital services and to foster greater user acceptance.
Keywords:
Technology Acceptance Model, Museum Mobile Guide System, User Experience, Influence Factors1. Introduction
With the advancement of information technologies, digitization and intelligent systems have emerged as key trends in the museum industry. As essential institutions for preserving and disseminating cultural heritage, museums are increasingly adopting museum mobile guide systems (MMGS) to offer enriched interactive experiences, improve access to information, and enhance the overall visitor journey. According to a 2022 report by the International Council of Museums (ICOM), over 60% of museums worldwide have implemented mobile guide systems, with the highest adoption rates in Europe and North America, and rapid growth in Asia (ICOM, 2023). In China, the Palace Museum has actively promoted digital transformation by launching several mobile applications that integrate Augmented Reality (AR), Virtual Reality (VR), and Artificial Intelligence (AI), providing a strong reference case for the global museum sector. Despite widespread implementation, challenges such as uneven information quality, non-intuitive interfaces, limited personalization, and weak immersive features persist. As a result, enhancing the user experience (UX) of MMGS and improving user loyalty and usage intention (UI) has become a critical area of both academic inquiry and practical innovation.
Prior studies have explored various dimensions of UX, including its conceptual definition, model construction, identification of influencing factors, and value assessment. However, limited attention has been given to the causal mechanisms through which UX elements influence usage behavior via perceptual pathways. The technology acceptance model (TAM) remains a widely accepted framework in information systems research to examine how users adopt new technologies. In a study on the MMGS, Bae (2019) employed the TAM to demonstrate that perceived usefulness, perceived ease of use, and perceived enjoyment exert significant positive effects on user satisfaction and behavioral intention. Lin (2023) further highlighted that multiple factors, including perceived usefulness, convenience, and system functionality influence user satisfaction within the context of MMGS. With the advancement of related research, scholars have progressively extended and refined the TAM framework to enhance its applicability across diverse target populations and technological domains.
This study investigates the causal pathways through which user experience factors influence user perception and UI in the context of MMGS, and further proposes corresponding optimization strategies. Grounded in the theoretical frameworks of UX and the TAM, an extended structural model is developed, accompanied by a set of hypotheses that are empirically tested to validate the path relationships and influence mechanisms. The findings not only contribute to the theoretical refinement of TAM and UX frameworks but also offer meaningful insights and practical implications for the digital transformation and service innovation within the museum sector.
2. Literature review
2. 1. Museum Mobile Guide Systems
Museum mobile guide systems (MMGS) refer to digital services offered by museums through mobile devices such as smartphones, tablets, dedicated guide terminals, and smart bands. These systems typically include functions such as navigation, interpretation, interaction, and information dissemination. The term MMGS encompasses a variety of related concepts, including mobile docent apps, digital guides, mobile exhibition guidance platforms, and interactive interpretation systems (Bae, 2019). Currently, most mobile guide systems are primarily implemented on smartphone platforms, leveraging the inherent characteristics of mobile terminals, including portability, personalization, intuitive interaction, ubiquity, high accessibility, location-awareness, and context-aware capabilities (Lee, 2013). According to Cheon (2021), most existing research on MMGS has predominantly focused on information quality, system usability, and the application of digital technologies, while relatively little attention has been paid to audience needs and user experience factors. From a developmental perspective grounded in UX and perceived needs, this study summarizes the evolution of MMGS across three key stages. In the initial phase, MMGS primarily served to support exhibition route navigation, object information delivery, and basic cultural services. Systems at this stage emphasized functional simplicity and informational efficiency, enabling visitors to obtain necessary data and plan their visits quickly. With the advancement of digital technologies, MMGS transitioned into an interactive phase, integrating multimedia elements such as audio, video, images, and interactive interfaces, thereby expanding content delivery from textual modes to multimodal formats.
Additionally, technologies like AR and VR were employed to enhance immersion, engagement, and educational impact. At present, MMGS has entered an intelligent phase, characterized by user-centered design and personalized experiences. Leveraging AI, such systems now support smart navigation, context-aware recommendations, and community-driven interactions, offering visitors tailored cultural itineraries and entertainment-rich exploratory experiences.
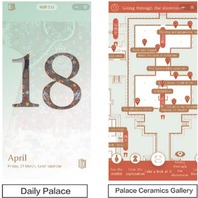
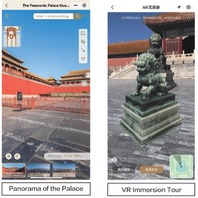
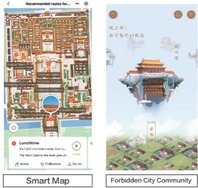
The Palace Museum, the largest institution dedicated to ancient Chinese art and cultural heritage, serves as a paradigmatic example of digital transformation in the museum sector. As summarized in Table 1, its MMGS has been widely recognized for its excellence in interface design, UX, technological innovation, and the integration of digital technologies into cultural services. These achievements underscore the system’s considerable academic Significance and practical impact (Kang, 2021).

Case Study of The Palace Museum Mobile Guide Application
2. 2. Technology Acceptance Model
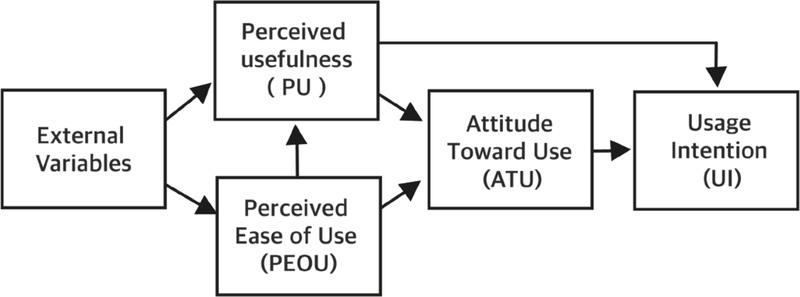
The technology acceptance model (TAM) was first proposed by Davis (1985) as a theoretical framework for explaining and predicting individuals’ acceptance behavior toward information systems. According to Davis (1989), external variables exert a direct influence on two core perceptual constructs: perceived usefulness (PU) and perceived ease of use (PEOU). These constructs significantly shape users’ attitude toward use (ATU), which subsequently determines their UI. The structure of the TAM is illustrated in Figure 1. A substantial body of empirical research has confirmed a reciprocal relationship between PU and PEOU, demonstrating that when a technology is perceived as easy to use, it is also more likely to be perceived as useful. This combined effect of perceived ease and usefulness has been shown to influence users’ continuous UI positively. To capture the affective and hedonic dimensions of user interaction, the construct of perceived enjoyment (PE) was initially introduced by Lieberman (1977) and later integrated into extended versions of TAM by Davis and other researchers (Tian, 2022). This construct highlights the pleasure and intrinsic enjoyment experienced during system use, which significantly contributes to shaping users’ behavioral intentions. Over time, TAM has evolved into one of the most widely adopted models for explaining user behavior in information system research. Numerous studies have sought to enhance its predictive power and theoretical robustness by integrating complementary models and incorporating novel external, mediating, and moderating variables (Surendran, 2012).
Technology Acceptance Model (TAM)
2. 3. User Experience
Donald Norman first introduced the concept of User-Centered Design (UCD) in 1986, emphasizing the critical role of addressing user needs to enhance usability and functional utility. In the 1990s, he formalized and disseminated the concept of user experience (UX) (Norman, 2013). According to the international standard (ISO 9241-210, 2008), UX is defined as “a person’s perceptions and responses resulting from the use or anticipated use of a product, system, or service.” The theoretical Significance of UX has become increasingly prominent in the field of technology acceptance. Within the context of MMGS, UX encompasses not only the functional aspects of the system itself but also users’ subjective perceptions and aesthetic evaluations during the interaction process (Hassenzahl, 2003). A foundational framework frequently adopted in UX studies is the Experience Economy Theory proposed by Pine & Gilmore (1999), which explains user value perception in experiential consumption and service-oriented settings. This theory categorizes user experience into four quadrants, known as the “4Es”: the Entertainment dimension refers to passive enjoyment through visual and auditory stimuli; the Education dimension involves active participation, learning, and knowledge acquisition; the Esthetics dimension relates to aesthetic pleasure derived from visual design or environmental staging; and the Escapist dimension reflects immersive experiences gained through sensory engagement and atmospheric immersion.
Hassenzahl (2010) further developed a UX model that classifies product experience into two primary dimensions: Pragmatic Quality and Hedonic Quality, representing functional utility and emotional satisfaction, respectively. Thüring & Mahlke (2007) introduced a three-dimensional UX framework comprising Aesthetics, Functionality, and Emotion, emphasizing that aesthetic design, system functionality, and emotional response collectively shape users’ overall experience and attitudinal evaluation during human–system interaction. In cultural, entertainment, or experience-driven technology contexts, the applicability of the TAM may be subject to contextual constraints (Liu, 2020). To better explain user adoption behavior of MMGS, this study draws on the Experience Economy Theory. It integrates established UX models to extend the TAM by incorporating three UX-related external constructs: Aesthetic Experience, Functional Experience, and Emotional Experience.
Accurate definition and measurement of user experience serve as a crucial foundation for understanding how to enhance UX in multimedia services. A comprehensive review of the literature reveals that empirical UX research frequently employs a variety of quantitative analytical models to explore the relationship between perceptual variables and user behavior. Common approaches include linear regression models, weighted composite models, the SEM technique, and the Kano model. Among these, SEM stands out as a statistical modeling technique that integrates both measurement and structural components, allowing for simultaneous analysis of multiple latent variables and their causal pathways (Collier, 2020).
SEM has been widely applied across disciplines such as psychology, education, information systems, marketing, and UX research (Hair et al., 2021). Within UX and technology acceptance research, SEM enables the construction of complex relational paths among perceptual factors, affective experiences, and UI, thereby enhancing both the explanatory power and model fit (Choi et al., 2013; Venkatesh et al., 2012). For instance, Hassenzahl (2001) demonstrated that pragmatic and hedonic attributes influence users’ overall evaluation of product attractiveness via satisfaction as a mediating factor. In information systems research, Liu et al. (2019) used SEM to investigate how external system attributes influence students’ UI through the mediation of Emotional Experience. Compared with traditional linear regression methods, SEM provides the advantage of estimating both direct effects and more complex structures involving mediation and moderation (Baron & Kenny, 1986).
3. Methods
3. 1. Research Model and Variable Definition
This study extends the traditional TAM (Davis, 1989) by incorporating the contextual features of MMGS. The proposed research model integrates both the perceived belief pathways of TAM and the external user experience factors, as illustrated in Figure 2. AE, FE, and EE are conceptualized as external factors expected to influence PU, PEOU, and PE. These perceptual constructs, in turn, affect UI through internal belief pathways.
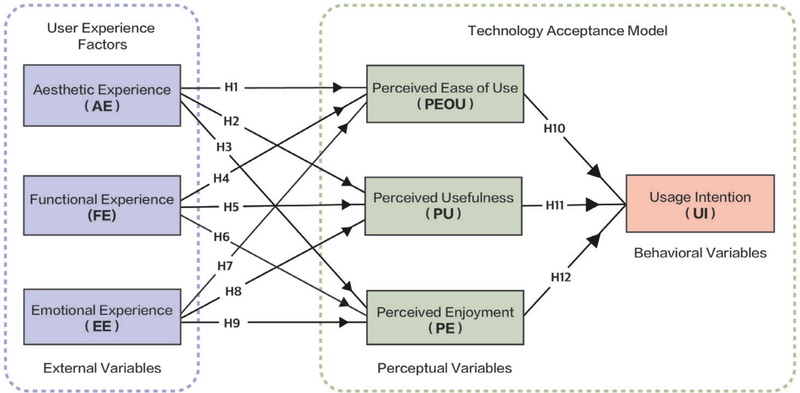
Research Model
The external variables emphasize system design characteristics and user interaction experiences, while the intrinsic belief variables highlight users’ subjective cognitive evaluations of the system, representing distinct conceptual dimensions. Table 2 provides detailed definitions of the variables to delineate the content of each construct and clarify the scope of measurement.
UX Factors, Indicators, and References
3. 2. Research Hypotheses
UI adoption of MMGS is not solely determined by their PU and PEOU, but is also influenced by a range of experiential factors. AE refers to users’ subjective aesthetic perceptions of the system’s interface design and visual appeal, which constitute an immediate and intuitive form of experience. Visually attractive interface design can enhance user satisfaction and enjoyment, which in turn strengthens perceptions of the system’s usefulness, ease of use, and enjoyment (Denison-Day, 2023). Pantano (2017) also confirmed that aesthetic quality exerts a significant positive impact on the perceptual variables within the TAM framework. The positive emotions evoked by AE can elevate users’ evaluation of the system’s overall value, as users tend to associate visually refined systems with higher quality and functionality (Cheng, 2024). Particularly in the museum context, a well-crafted interface and appealing visual presentation can increase the attractiveness and engagement of the guided content. Based on the above theoretical and empirical evidence, the following hypothesis is proposed:
H1: AE has a positive effect on PEOU.
H2: AE has a positive effect on PU.
H3: AE has a positive effect on PE.
Bae (2019) verified that the functional attributes of MMGS, including information quality, system quality, and technical quality, have a significant and positive influence on both PU and PEOU. Pantano (2017) further validated the hypothesis that system response time and information accuracy exert a positive effect on PU. These findings collectively suggest that a well-optimized functional design contributes to enhanced information retrieval efficiency, system responsiveness, and overall service quality. Based on this evidence, the following hypotheses are proposed:
H4: FE has a positive effect on PEOU.
H5: FE has a positive effect on PU.
H6: FE has a positive effect on PE.
Hassenzahl (2010) emphasized that fulfilling users’ emotional and psychological needs is a core factor shaping UX. EE enhances PE and ultimately leads to greater user satisfaction. Norman (2005) also proposed that emotion-centered design can improve user engagement, perceived quality, and affective connection. As users become more emotionally invested, their evaluation of the system improves, which in turn increases usage frequency and behavioral intention. Based on this reasoning, the following hypotheses are proposed:
H7: EE has a positive effect on PEOU.
H8: EE has a positive effect on PU.
H9: EE has a positive effect on PE.
In line with the core logic of the TAM, several studies, including those by Kim (2024), Lin (2023), and Bae (2019), have validated that both PU and PEOU have positive effects on UI. Additionally, Tian (2022) and Kim (2013) demonstrated that PE significantly enhances users’ intention to use the system and serves as a critical factor in promoting both user satisfaction and usage stickiness. Therefore, this study proposes the following integrative hypothesis:
H10: PEOU has a positive effect on UI.
H11: PU has a positive effect on UI.
H12: PE has a positive effect on UI.
According to the TAM theoretical framework, the inf luence of external variables on behavioral intention is primarily mediated through users’ internal evaluations and perceptual beliefs (Zhang & Li, 2005). Based on the mediation effect theory proposed by Baron & Kenny (1986), if external variables affect the outcome variable through mediators, testing these mediation pathways becomes a critical component of the theoretical model. In this study, AE, FE, and EE are expected to influence UI through PU, PEOU, and PE indirectly. On one hand, no direct paths are established from AE, FE, and EE to UI because their influence is assumed to be transformed into users’ subjective evaluations of the system’s usefulness, ease of use, and enjoyment, which subsequently affect behavioral intention. On the other hand, introducing mediating variables helps uncover the internal mechanisms through which external experiential factors exert their effects, thereby enhancing the explanatory power of the model. Accordingly, the following hypotheses are proposed:
H13: PEOU mediates the relationship between AE, FE,EE, and UI.
H14: PU mediates the relationship between AE, FE,EE, and UI.
H15: PE mediates the relationship between AE, FE,EE, and UI.
3. 3. Measurement of Variables and Survey Composition
Grounded in User Experience Theory and the TAM, this study adopts a questionnaire-based survey approach to investigate the determinants of user experience in MMGS. The questionnaire was structured around three categories of variables: external variables, perceptual variables, and behavioral variables. All measurement items were adapted from validated instruments in prior literature and tailored to reflect the actual user context of the Palace Museum’s MMGS. The external variables include AE, FE, and EE. Each of these constructs was measured using three items, designed to capture users’ experiential expectations of the system. The perceptual variables, including PEOU, PU, and PE, were each measured using three items. These items were designed to capture users’ cognitive evaluations regarding system usability, functional utility, and hedonic value. The behavioral variable, UI, was assessed using two items to examine the influence of both experiential and perceptual constructs on users’ behavioral intentions. All items were rated using a five-point Likert scale (1 = Strongly Disagree, 2 = Disagree, 3 = Neutral, 4 = Agree, 5 = Strongly Agree). The full list of constructs and corresponding measurement items is presented in Table 3.
Measurement Items
3. 4. Data and Analysis
This study selected the official mobile guide application of the Palace Museum as the empirical case. Developed on WeChat, a leading social platform in China, the application is characterized by user-friendly operation, comprehensive functionality, and broad user adoption. As illustrated in Figure 3, the system offers a range of services, including artifact appreciation, smart map navigation, personalized recommendations, AR exploration, and virtual museum experiences, making it well-suited for investigating the determinants of user experience in MMGS.
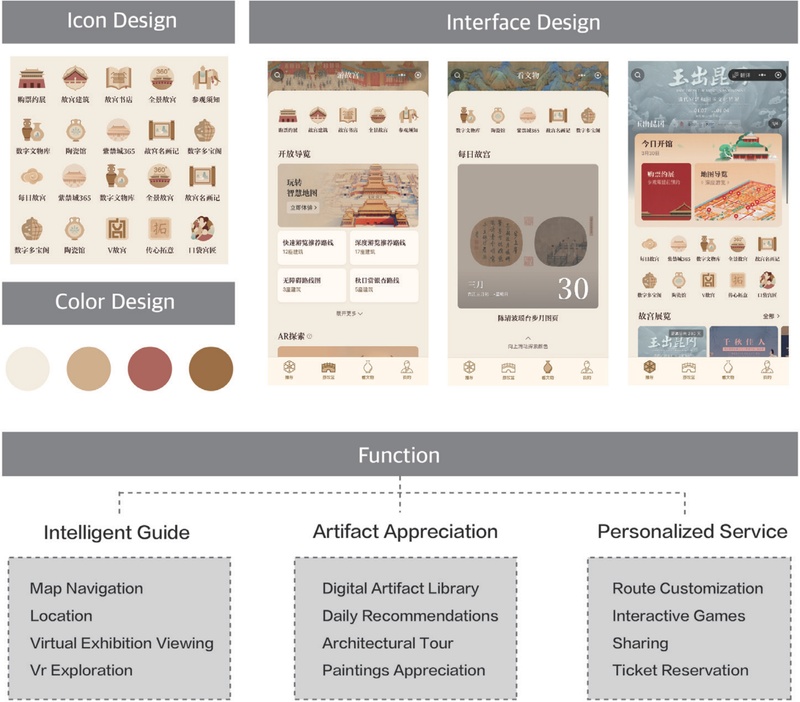
The official mobile application of The Palace Museum
Data collection began on January 3, 2025, employing a mixed-method survey approach that combined both offline and online channels to enhance sample diversity and representativeness. For the offline survey, researchers conducted random on-site sampling within the Palace Museum grounds, inviting visitors to participate in compensated questionnaires, with an emphasis on gathering authentic user feedback and contextual usage data. The online survey was distributed via Credamo, a professional Chinese survey platform. It targeted individuals with prior experience using the MMGS, thereby expanding the sample scope and increasing heterogeneity in respondent profiles. A total of 523 valid responses were obtained, encompassing diverse demographic characteristics including gender, age, occupational background, and frequency of MMGS usage. The sample was deemed sufficiently representative to support subsequent construct measurement, model validation, and path analysis.
Regarding the analytical procedures, descriptive statistics were first performed to summarize respondent demographics and application usage patterns. Subsequently, data were processed using Statistical Package for the Social Sciences (SPSS) and Analysis of Moment Structures (AMOS). To ensure the reliability and validity of the measurement instruments, reliability analysis, correlation analysis, and Confirmatory Factor Analysis (CFA) were conducted. Finally, SEM was employed to test the hypothesized relationships and underlying mechanisms among variables.
4.Result
4. 1. Demographics
Basic demographic data, including gender, age, occupation, and application usage frequency, were collected in the survey. As shown in Table 4, the composition of the sample is relatively well-balanced and exhibits sufficient representativeness for empirical analysis. Female respondents accounted for 50.48% (N = 264), and male respondents represented 49.52% (N = 259), reflecting a balanced gender distribution across the sample. In terms of age, the majority of participants (53.15%) were between 26 and 45 years old, a demographic typically characterized by greater digital adaptability and a higher propensity for cultural consumption. Regarding occupational background, company employees constituted the largest group (52.39%, N = 274), suggesting a stronger inclination among this segment to use mobile guide tools for accessing cultural information and enriching their museum experience. Although the proportions of students and educators were relatively lower, they remain relevant segments with the potential to become active users of MMGS.
Demographic Profile of Respondents
Concerning usage frequency, the findings revealed that 39.96% (N = 209) of respondents had used the Palace Museum MMGS more than three times, while 35.75% (N = 187) had used it two to three times. These results indicate a notable degree of user loyalty and practical utility of the application within the target population.
4. 2. Test of Reliability and Validity
To ensure the robustness of the structural model and the credibility of the empirical data, this study conducted reliability and validity assessments for seven latent constructs: AE, FE, EE, PEOU, PU, PE, and UI.
Reliability was evaluated using Cronbach’s Alpha, a standard indicator of internal consistency. According to Guielford (1965), values above 0.70 indicate acceptable reliability, with higher values denoting greater measurement stability. The analysis revealed Cronbach’s Alpha values of AE = 0.824, FE = 0.858, EE = 0.842, PEOU = 0.812, PU = 0.814, PE = 0.805, and UI = 0.710. These results confirm that all scales demonstrated satisfactory internal consistency and reliability. To evaluate the measurement quality of the proposed model, CFA was conducted with an emphasis on convergent validity and construct reliability. Following the guidelines established by Campbell & Fiske (1959), standardized factor loadings above 0.70, Composite Reliability (CR) values greater than 0.70, and Average Variance Extracted (AVE) values of at least 0.50 are indicative of acceptable measurement validity. As presented in Table 5, all indicators exhibited loadings above 0.70. The AVE values for all latent constructs ranged from 0.562 to 0.669, exceeding the required threshold, thereby demonstrating adequate variance explanation. Similarly, CR values ranged from 0.717 to 0.858, further supporting the internal consistency and reliability of the constructs.
Demographic Profile of Respondents
To assess discriminant validity, the Fornell–Larcker criterion was applied (Fornell & Larcker, 1981). Specifically, if the square root of a construct’s AVE exceeds its correlations with other constructs, discriminant validity is considered established (Bagozzi & Phillips, 1991). Table 6 results confirmed that all constructs satisfied this condition, indicating sound discriminant validity within the measurement model.
Results of discriminate validity
4. 3. Structural Equation Modeling
Following the reliability and validity assessments, an SEM was constructed using AMOS to evaluate the hypothesized relationships. SEM enables the estimation of causal paths among latent variables, thereby supporting hypothesis validation and model fitness assessment.
As shown in Table 7, the model demonstrated an excellent fit to the data. The chi-square to degrees of freedom ratio (□²/df) was 1.968, below the recommended threshold of 3.0. The Goodness-of-Fit Index (GFI) reached 0.947, exceeding the 0.90 benchmark. Additional indices also confirmed model adequacy: Tucker–Lewis Index (TLI) = 0.963, Comparative Fit Index (CFI) =0.971, and Normed Fit Index (NFI) = 0.943. Moreover, the Root Mean Square Error of Approximation (RMSEA) was 0.043, well below the accepted threshold of 0.08, and the Standardized Root Mean Square Residual (SRMR) was 0.039, indicating a good model fit. According to Kline(2011), these indices collectively indicate that the structural model exhibits strong empirical validity and meets conventional goodness-of-fit standards.
Model Fit Summary of SEM
The path diagram presented in Figure 4 illustrates the causal structure and strength of the relationships among constructs, highlighting the key experiential and perceptual factors affecting users’ behavioral intentions toward MMGS.
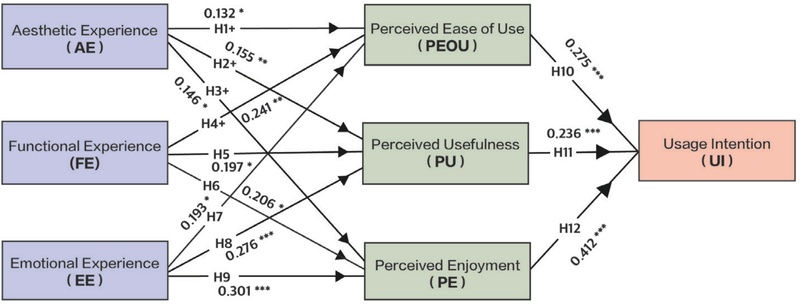
Results of Research Model
Detailed parameter estimates are reported in Table 8, including standardized regression coefficients (β), unstandardized coefficients (B), standard errors (S.E.), critical ratios (C.R.), and p-values. These results confirm the statistical Significance and directionality of each hypothesized path, thereby clarifying the interdependencies among constructs.
Correlation Matrix between Constructs
The path analysis revealed that AE, FE, and EE each exerted significant positive effects on PEOU, PU, and PE (p < 0.05). Specifically, AE significantly influenced PEOU (β = 0.132, C.R. = 2.093, p = 0.036) and PU (β = 0.155, C.R. = 2.793, p = 0.005); FE had notable effects on PEOU (β = 0.241, C.R. = 2.778, p = 0.005) and PU (β = 0.197, C.R. = 2.569, p = 0.010); and EE exhibited the strongest impact on PE (β = 0.301, C.R. = 3.767, p < 0.001), while also significantly affecting PU (β = 0.276, C.R. = 3.687, p < 0.001) and PEOU (β = 0.193, C.R. = 2.345, p = 0.019). Furthermore, PEOU (β = 0.275, C.R. = 4.744, p < 0.001), PU (β = 0.236, C.R. = 3.697, p < 0.001), and PE (β = 0.412, C.R. = 6.649, p < 0.001) all positively predicted UI, with PE emerging as the most influential driver, underscoring the pivotal role of enjoyment in shaping UI. In addition, AE, FE, and EE indirectly enhanced UI through PEOU, PU, and PE, providing empirical evidence to support strategies for optimizing user experience and increasing UI.
As shown in Table 9, the path mediation analysis revealed heterogeneous indirect effects of different paths on UI. The indirect effect of AE→PEOU→UI (0.03, p=0.102) was not significant, whereas FE→PEOU→UI (0.045, p=0.006) was significant and EE→PEOU→UI (0.04, p=0.052) was marginally significant. Mediation through PU was significant for all paths: AE→PU→UI (0.03, p=0.016), FE→PU→UI (0.031, p=0.028), and EE→PU→UI (0.049, p=0.008). Similarly, mediation through PE was significant for AE→PE→UI (0.05, p=0.042), FE→PE→UI (0.057, p=0.047), and EE→PE→UI (0.094, p=0.001). These results indicate that PEOU, PU, and PE function as key mediators across multiple paths, substantially enhancing UI.
Results of Path Mediation Analysis
5. Conclusion
5. 1. Discussion
This study constructed and empirically validated a structural model to investigate the influencing factors of user experience in MMGS, grounded in the TAM and user experience theory. The model incorporated three core dimensions of user experience (Aesthetic, Functional, Emotional) as external variables, and specified PU, PEOU, and PE as mediating variables, ultimately examining their effect on UI. Using the official mobile guide application of the Palace Museum as a case study, data were collected via questionnaire and analyzed using SEM. The results indicate that the model demonstrates a satisfactory overall fit (χ²/df = 1.968, GFI = 0.947, CFI = 0.971, TLI = 0.963, RMSEA = 0.043, SRMR = 0.039), with most hypothesized paths achieving statistical Significance. AE, FE, and EE all exert significant positive effects on PEOU, PU, and PE, with EE having the strongest effect on PE (β = 0.301, C.R. = 3.767, p < 0.001) and FE showing the greatest influence on PEOU (β = 0.241, C.R. = 2.778, p = 0.005). Among the perceptual variables, PE (β = 0.412, C.R. = 6.649, p < 0.001) and PU (β = 0.236, C.R. = 3.697, p < 0.001) emerge as the primary predictors of UI, with PE exerting the strongest influence. Mediation analysis further reveals that PEOU, PU, and PE serve as important mediators across multiple paths, with the indirect effect via PE being particularly pronounced.
In conclusion, this study confirms the significant influence of UX dimensions on both perceptual and behavioral variables, reinforces the explanatory power of the TAM within the context of cultural–technological integration, and extends the model through its integration with UX theory. These findings provide theoretical insights into the mechanisms by which users’ perceptual evaluations shape their behavioral intentions in digital cultural contexts, and offer empirical evidence to support museums in optimizing the aesthetic design, functional architecture, and emotional interaction strategies of MMGS.
5. 2. User Experience Optimization for MMGS
Based on the empirical findings, this study proposes user experience optimization strategies for MMGS, focusing on the dimensions of AE, FE, and EE. These strategies aim to enhance UI indirectly by improving PU, PEOU, and PE. The recommendations are derived from both the statistical relationships among constructs and theoretical reasoning, providing actionable insights for future system design and practical implementation.
Aesthetic design significantly shapes users’ first impressions and PEOU (Lavie & Tractinsky, 2004). MMGS interfaces should prioritize visual consistency and coherent styling—through color schemes, iconography, and typography—to create a seamless interactive experience. For example, the Palace Museum App integrates traditional palace motifs and decorative elements to enhance cultural immersion and aesthetic appeal (Li & Yu, 2021), and the Louvre Official Guide App, which enhances the user experience through high-resolution artworks and minimalist French-inspired layouts (Hanussek, 2020). Future designs may adopt similar cultural-visual integration further to improve users’ visual satisfaction and cultural identification. Functional design remains crucial for optimizing PU and ease of use (Bae, 2019). Enhancing information architecture, navigation flow, and retrieval efficiency can minimize user effort. For instance, the British Museum Guide App offers multilingual search, precise location services, and personalized exhibition recommendations, enabling efficient information access. Similarly, the Palace Museum Digital Collection utilizes AR and 3D reconstruction technologies to strengthen interactivity and information richness (Lee et al., 2020). Building on these practices, MMGS can integrate intelligent recommendation engines, context-aware services, and AR/VR features to expand service scope and diversify content delivery. Emotional design effectively enhances user enjoyment and engagement (Zhang & Li, 2005). The British Museum Interactive Quiz System, for example, increases participation through challenge-based tasks and reward mechanisms. In contrast, the Kyoto National Museum App employs virtual characters and scenario-based storytelling to deepen immersion. Drawing on these approaches, MMGS could incorporate social sharing, virtual guide avatars, and interactive gamification to foster stronger emotional connections and playful experiences.
5. 3. Limitations and Further Research
Despite yielding valuable insights, this study is subject to several limitations. First, the sample was drawn exclusively from users of the Palace Museum’s official guide app, which may introduce sample bias and limit generalizability. Future research should include users from diverse museums and adopt cross-institutional comparative approaches to enhance external validity. Second, the study was based on cross-sectional data, which constrains the ability to capture temporal changes in user behavior. Future investigations may adopt longitudinal research designs to explore how UX factors influence usage behavior over time. Lastly, this study did not consider broader contextual variables such as sociocultural background or technological exposure. Incorporating such external variables in future research could enrich the model’s theoretical depth and practical applicability, offering new directions for studies on user interaction in digital cultural environments.
Acknowledgments
This work was supported by the Ministry of Education of the Republic of Korea and the National Research Foundation of Korea (NRF) in 2020 (NRF-2020S1A5C2A02092454).
Notes
Copyright : This is an Open Access article distributed under the terms of the Creative Commons Attribution Non-Commercial License (http://creativecommons.org/licenses/by-nc/3.0/), which permits unrestricted educational and non-commercial use, provided the original work is properly cited.
References
- Bae, E. J. (2019). A study on the adoption and performance of museum mobile guides: Focusing on the Technology Acceptance Model (Unpublished doctoral dissertation). Sangmyung University, Seoul, Korea.
- Lin, J. (2023). A study on the design strategy of user experience for museum mobile applications (Unpublished doctoral dissertation). Dong-A University, Busan, Korea.
-
Lee, B. A. (2013). A case study on the importance of the non-interfering characteristics of mobile devices in interactive exhibition environments. Journal of the Korean Society of Computer and Information, 18(1), 31-42.
[https://doi.org/10.9708/jksci.2013.18.1.031]

- Cheon, L. (2021). A study on the emotional experience design of museum mobile guide systems(Unpublished master's thesis). Kangnam University, Yongin, Korea.
- Kang, X. L. (2021). Exploring the enhancement path of digital services at the Palace Museum in the digital age. New Media Research, 7(23), 23-26.
- Davis, F. D. (1985). A technology acceptance model for empirically testing new end-user information systems: Theory and results(Doctoral dissertation, Massachusetts Institute of Technology).
-
Davis, F. D. (1989). Perceived usefulness, perceived ease of use, and user acceptance of information technology. MIS Quarterly, 319-340.
[https://doi.org/10.2307/249008]
- Lieberman, D. A. (1977). Playfulness: Its relationship to imagination and creativity. Academic Psychology Bulletin, 1(2), 23-41.
-
Pantano, E., Rese, A., & Baier, D.(2017). Enhancing the online decision-making process by using augmented reality: A two-country comparison of youth markets. Journal of Retailing and Consumer Services, 38, 81-95.
[https://doi.org/10.1016/j.jretconser.2017.05.011]
- Surendran, P. (2012). Technology acceptance model: A survey of literature. International Journal of Business and Social Research, 2(4), 175-178.
- Norman, D. A.(2013). The design of everyday things: Revised and expanded edition. New York: Basic Books.
- ISO 9241-210. (2008). Ergonomics of human-system interaction-Human centered design for interactive systems. Geneva: ISO.
-
Hassenzahl, M. (2003). The thing and I: Understanding the relationship between user and product. Funology (pp. 31-42). Springer.
[https://doi.org/10.1007/1-4020-2967-5_4]
- Pine, B. J., & Gilmore, J. H. (2011). The experience economy (pp. 45-46). Harvard Business Press.
-
Hassenzahl, M. (2010). Experience design: Technology for all the right reasons (pp. 49-50). Morgan & Claypool Publishers.
[https://doi.org/10.1007/978-3-031-02191-6]
-
Thüring, M., & Mahlke, S. (2007). Usability, aesthetics and emotions in human-technology interaction. International Journal of Psychology, 42(4), 253-264.
[https://doi.org/10.1080/00207590701396674]
- Liu, W. N. (2020). A study on the optimization of museum audience experience service based on the IPOP theory. China Museum, 6(3), 68-74.
-
Collier, J. E. (2020). Applied structural equation modeling using AMOS: Basic to advanced techniques. Routledge.
[https://doi.org/10.4324/9781003018414]
-
Hair Jr, J. F., Hult, G. T. M., Ringle, C. M., Sarstedt, M., Danks, N. P., & Ray, S. (2021). Partial least squares structural equation modeling (PLS-SEM) using R: A workbook (p. 197). Springer Nature.
[https://doi.org/10.1007/978-3-030-80519-7]
- Choi, H., Choi, Y., & Kim, J. (2013). A study on the relationships among the technology acceptance model, user experience, and usage intention in mobile games. Journal of the Korea Contents Association, 13(12), 231-241.
-
Venkatesh, V., Thong, J. Y. L., & Xu, X. (2012). Consumer acceptance and use of information technology: Extending the unified theory of acceptance and use of technology. MIS Quarterly, 36(1), 157-178.
[https://doi.org/10.2307/41410412]
- Liu, X., Liu, J., & Chen, Y. (2019). Emotional experience and technology acceptance: A structural equation modeling approach. Educational Technology Research and Development, 67(3), 587-604.
-
Baron, R. M., & Kenny, D. A. (1986). The moderator-mediator variable distinction in social psychological research: Conceptual, strategic, and statistical considerations. Journal of Personality and Social Psychology, 51(6), 1173-1182.
[https://doi.org/10.1037/0022-3514.51.6.1173]
-
Denison-Day, J. L., Muir, S., Newell, C., & Appleton, K. M. (2023). The role of aesthetics in intentions to use digital health interventions. PLOS Digital Health, 2(6).
[https://doi.org/10.1371/journal.pdig.0000274]
-
Cheng, A., Ma, D., Pan, Y., & Qian, H. (2024). Enhancing museum visiting experience: Investigating the relationships between augmented reality quality, immersion, and TAM using PLS-SEM. International Journal of Human-Computer Interaction, 40(17), 4521-4532.
[https://doi.org/10.1080/10447318.2023.2227832]
-
Pantano, E., Rese, A., & Baier, D. (2017). Enhancing the online decision-making process by using augmented reality: A two country comparison of youth markets. Journal of Retailing and Consumer Services, 38, 81-95.
[https://doi.org/10.1016/j.jretconser.2017.05.011]
-
Hassenzahl, M. (2010). Experience design: Technology for all the right reasons (Vol. 8). Morgan & Claypool Publishers.
[https://doi.org/10.1007/978-3-031-02191-6]
-
Kim, J. E., & Kim, M. R. (2024). Exploring the use intention of ChatGPT as a learning tool based on the Technology Acceptance Model. Journal of Computer Education, 27(3).
[https://doi.org/10.32431/kace.2024.27.3.007]
- Kim, J. K. (2013). A study on the use intention of mobile applications by category based on the technology readiness acceptance model (Unpublished doctoral dissertation). Kongju National University, Kongju, South Korea.
-
Zhang, P., & Li, N. (2005). The importance of affective quality. Communications of the ACM, 48(9), 105-108.
[https://doi.org/10.1145/1081992.1081997]
-
Campbell, D. T., & Fiske, D. W. (1959). Convergent and discriminant validation by the multitrait-multimethod matrix. Psychological Bulletin, 56(2), 81-105.
[https://doi.org/10.1037/h0046016]
-
Fornell, C., & Larcker, D. F. (1981). Evaluating structural equation models with unobservable variables and measurement error. Journal of Marketing Research, 18(1), 39-50.
[https://doi.org/10.1177/002224378101800104]
-
Bagozzi, R. P., Yi, Y., & Phillips, L. W.(1991). Assessing construct validity in organizational research. Administrative Science Quarterly, 36(3), 421-458.
[https://doi.org/10.2307/2393203]
- Kline, R. B. (2011). Principles and practice of structural equation modeling(3rd ed.). The Guilford Press.
-
Lavie, T., & Tractinsky, N. (2004). Assessing dimensions of perceived visual aesthetics of web sites. International Journal of Human-Computer Studies, 60(3), 269-298.
[https://doi.org/10.1016/j.ijhcs.2003.09.002]
- Li, H., & Yu, L. (2021). Cultural heritage mobile applications and visitor experience: A case study of the Palace Museum. Journal of Cultural Heritage Management and Sustainable Development, 11(4), 458-474.
-
Hanussek, B. (2020). Enhanced exhibitions? Discussing museum apps after a decade of development. Advances in Archaeological Practice, 8(2), 206-12.
[https://doi.org/10.1017/aap.2020.10]
-
Lee, H., Jung, T. H., tom Dieck, M. C., & Chung, N. (2020). Experiencing immersive virtual reality in museums. Information & management, 57(5), 103229.
[https://doi.org/10.1016/j.im.2019.103229]
-
Zhang, P., & Li, N. (2005). The importance of affective quality. Communications of the ACM, 48(9), 105-108.
[https://doi.org/10.1145/1081992.1081997]