
Improving Onboarding for Inexperienced Users: A Research on EV Charging Services
Abstract
Background The growing adoption of electric vehicles (EVs) has brought attention to the importance of effective onboarding tutorials for charging systems, particularly for Inexperienced users. Poorly designed tutorials may lead to increased cognitive load, operational errors, and user frustration. This research investigates how different tutorial formats—Illustrated (paper-based), Scrolling (digital-linear), and Interactive (digital-modular)—influence user comprehension, engagement, and task performance in EV charging contexts.
Methods Thirty Japanese university students with no prior EV-charging experience were randomly assigned to one of the three tutorial formats. After an onboarding session, participants completed a simulated charging task. Behavioral metrics (onboarding time, task completion time, error clicks, comprehension test scores) and self-reported measures (cognitive load, engagement, pre/post understanding and safety awareness) were collected; brief interviews provided contextual qualitative feedback.
Results The Interactive tutorial produced the shortest onboarding time and the highest engagement, but comprehension was more variable, and navigation confusion was reported. The Illustrated tutorial imposed higher mental/physical demand yet yielded the highest comprehension accuracy and the fewest operational errors. The Scrolling tutorial was perceived as simple but showed higher error rates and moderate engagement. Across conditions, self-assessed understanding and safety awareness improved from pre-to post-onboarding. Significant differences in mental demand and frustration reflected trade-offs between user control, clarity, and cognitive burden. Overall, findings do not support an assumption of Interactive being universally superior; each format showed differentiated strengths.
Conclusions No single tutorial outperforms others across all dimensions. Tutorial selection should be contingent on context and goals: Illustrated is preferable for safety-critical accuracy and confidence, Interactive for motivation and sustained attention, and Scrolling for quick familiarization. A hybrid strategy-retaining a structured narrative while adding minimal, well-placed interactive scaffolds-appears promising for balancing accuracy, confidence, and engagement in EV charging onboarding.
Keywords:
EV Charging Service, Onboarding, Tutorial Design, User Experience, Human-Computer Interaction1. Introduction
The increasing adoption of electric vehicles (EVs) worldwide has brought about a parallel rise in the demand for efficient and user-friendly EV charging infrastructure. As charging stations become integral to the transition toward sustainable transportation, the interaction between Inexperienced users and these systems has emerged as a critical determinant of user satisfaction and technology adoption. Despite significant advancements in EV infrastructure, the onboarding experience—particularly the design and effectiveness of instructional materials for Inexperienced users—remains underexplored. Poorly designed tutorials often result in operational errors, heightened cognitive load, and user frustration, underscoring the need for research into optimal tutorial formats and navigation structures.
1. 1. Background and Theoretical Framework
Effective onboarding plays a pivotal role in enhancing user comprehension and reducing cognitive barriers, especially when interacting with complex technical systems like EV charging stations. According to Cognitive Load Theory (CLT) (Chandler & Sweller, 1991; Sweller, 2010), the efficiency of learning and task execution is directly influenced by the balance between intrinsic, extraneous, and germane cognitive loads. For Inexperienced EV users, the unfamiliarity with charging procedures can amplify intrinsic cognitive load, while poorly designed instructional materials may exacerbate extraneous load, impeding overall learning outcomes. Integrating visual aids and intuitive navigation into tutorials, as noted in Mayer’s (2009) multimedia learning theory, can mitigate these effects by utilizing both visual and verbal processing channels to enhance comprehension and memory retention. The onboarding process further benefits from the application of user-centered design principles, which prioritize clarity, usability, and adaptability (Wogalter et al., 2002). In the context of EV charging, onboarding tutorials must address diverse user needs, from understanding basic safety precautions to mastering operational procedures. As recent studies (e.g., Dhanoa et al., 2022) have demonstrated, visualization storytelling models such as the Martini Glass framework can facilitate modular and user-driven content exploration, reduce frustration and increase engagement.
1. 2. Challenges in EV Charging Onboarding
While user manuals and tutorials are standard tools for technical onboarding, the rapidly evolving nature of EV infrastructure presents unique challenges. Inexperienced EV users often face fragmented interfaces and inconsistent operational workflows, as noted in studies of EV ecosystems in Norway (Figenbaum et al., 2022) and Japan (Abe, 2015). These challenges are compounded by variations in tutorial media formats—ranging from static Illustrated guides to interactive digital interfaces—which influence users’ learning paths and operational accuracy. Research by Fabianek and Madlener (2023) and Clayton (2022) indicated the need for tutorials that balance reliability with adaptability, particularly for inexperienced users operating under time constraints.
Moreover, while traditional onboarding methods prioritize linear information delivery, dynamic and interactive formats are gaining traction. However, the potential benefits of increased navigation freedom, such as in user-driven tutorials, remain underexplored in the context of EV charging. Studies by Stoiber et al. (2021) and Dhanoa et al. (2023) suggest that while interactive designs can enhance engagement, they may also introduce decision fatigue, necessitating a careful balance between user autonomy and instructional guidance.
1. 3. Research Objectives and Contribution
This research seeks to address the gaps in EV charging onboarding research by systematically evaluating the effects of three tutorial formats—Illustrated, Scrolling, and Interactive—on user learning, engagement, and task performance. Specifically, the research aims to:
- 1. Assess how tutorial media and navigation structures influence Inexperienced users’ comprehension, onboarding time, and task accuracy.
- 2. Explore whether interactive tutorials, incorporating user-driven navigation, outperform traditional formats in fostering engagement and reducing cognitive load.
- 3. Provide actionable design recommendations for EV service providers to optimize onboarding tutorials for diverse user demographics.
By combining insights from cognitive load theory, multimedia learning, and user-centered design, this research advances the theoretical understanding of onboarding processes while offering practical solutions for improving user experiences in EV charging contexts. The findings contribute to the broader fields of human-computer interaction and sustainable mobility by addressing critical usability challenges in technical systems.
2. Literature Review
2. 1. Theoretical Foundations of Onboarding
Onboarding, as a process of guiding users to understand and effectively interact with a system, involves multiple dimensions, including cognitive load management, learning strategies, and engagement design. Cognitive Load Theory (CLT) (Chandler & Sweller, 1991; Sweller, 2010) categorizes cognitive load into intrinsic, extraneous, and germane components. For onboarding tutorials, the primary challenge is to reduce extraneous load—often caused by poorly structured information—while optimizing germane load to facilitate schema formation and learning.
Multimodal Learning Theory (Mayer, 2009) extends CLT by emphasizing dual-channel processing, where integrating textual and visual elements can significantly enhance comprehension and retention. However, as noted by Angeli and Valanides (2004), excessive multimodal content can inadvertently overwhelm users, necessitating careful instructional design. These principles align with findings by Dhanoa et al. (2022), who proposed the Dashboard Onboarding Loop, a model that integrates iterative user feedback to create adaptive and personalized onboarding experiences. This loop emphasizes structured introductions followed by exploratory learning, effectively balancing guidance with autonomy.
2. 2. Media Formats in Onboarding Tutorials
The choice of media format significantly influences onboarding outcomes. Illustrated tutorials, while static and linear, offer simplicity and reliability, making them particularly effective for tasks requiring precision (van der Meij & van der Meij, 2014). However, such formats lack the flexibility to accommodate diverse user needs. Digital tutorials, including scrollable and interactive designs, provide dynamic navigation but may introduce cognitive challenges, as noted in studies of augmented reality (Kolla et al., 2021). Interactive approaches, such as the D-Tour system (Dhanoa et al., 2023), have shown promise in enhancing engagement by enabling user-driven exploration. D-Tour’s semi-automatic generation of guided tours combines modularity with personalization, allowing users to adapt the onboarding process to their specific interests and knowledge gaps. This aligns with findings by Stoiber et al. (2021), who demonstrated that interactive designs could enhance learning efficiency, provided that the complexity of navigation is carefully managed.
2. 3. Challenges in EV Charging Onboarding
The onboarding experience in EV charging systems presents unique challenges due to fragmented interfaces, inconsistent workflows, and varied user demographics. Studies in Norway (Figenbaum et al., 2022) and Japan (Abe, 2015) indicated operational inefficiencies and user frustration stemming from disjointed instructional materials and incompatible payment systems. Fabianek and Madlener (2023) identified similar challenges in Germany, emphasizing the need for tutorials that are both intuitive and adaptable. In addition to operational clarity, onboarding tutorials must prioritize safety awareness. Clayton (2022) noted that informal user-driven solutions, such as community-based guidance, often fill gaps left by insufficiently designed instructional materials. These findings underline the importance of integrating user-centered design principles into EV charging tutorials to improve usability and reduce reliance on external support.
2. 4. Interactive Tutorials and Navigation Freedom
Dynamic and modular tutorials represent a shift from traditional linear onboarding methods to more flexible, user-driven approaches. Wu et al. (2024) observed that interactive onboarding designs significantly improve user engagement and confidence but also highlighted the risks of decision fatigue when navigation freedom is excessive. These findings are consistent with Stoiber et al. (2021), who emphasized the need for clear navigation cues to prevent cognitive overload. In EV charging contexts, balancing structured guidance with exploratory flexibility is critical to ensuring both efficiency and user satisfaction.
2. 5. Research Gaps and Summary
While substantial research has explored onboarding strategies in various domains, several gaps remain:
- 1. Limited studies have systematically compared static, scrollable, and interactive tutorials in technical onboarding contexts.
- 2. Most onboarding research focuses on task efficiency or usability, with less attention to safety awareness and cognitive load management.
- 3. The trade-offs between navigation freedom and cognitive demand in dynamic tutorials are insufficiently understood, particularly for Inexperienced users in high-stakes environments.
This research addresses these gaps by investigating the effects of tutorial format and navigation freedom on user learning, engagement, and safety awareness in EV charging systems. By integrating theoretical insights from CLT, multimodal learning, and storytelling frameworks, the research provides a comprehensive foundation for optimizing onboarding experiences.
3. Research Method
This research investigates the impact of different onboarding tutorial formats on Inexperienced users’ understanding, engagement, and safety awareness in the context of EV charging stations. By examining illustrated, scrolling, and interactive tutorials, the research seeks to identify effective design strategies for improving user experience and operational performance. This research primarily adopts a quantitative experimental framework, thematic insights from participant interviews were analyzed qualitatively to supplement the findings.
3. 1. Research Objectives and Research Questions
The primary goal of this research is to evaluate how varying levels of visual and interactive elements in onboarding tutorials influence users’ ability to comprehend and operate EV charging systems. More specifically, the research aims to:
- 1. Compare the learning outcomes, task performance, and changes in safety awareness across the three tutorial formats.
- 2. Assess the role of visual aids and interactive navigation in enhancing user engagement and reducing cognitive load.
- 3. Identify the tutorial format that most effectively supports user confidence, operational accuracy, and the development of a clear mental model of EV charging procedures.
By addressing these objectives, this research contributes to the design of user-centered instructional materials, offering insights into how different tutorial features can support the adoption of public EV charging systems.
The research questions are designed to explore the relationship between tutorial design and user performance, satisfaction, and engagement. These include:
- 1. How do illustrated, scrolling, and interactive tutorials impact Inexperienced users’ understanding of EV charging procedures and their safety awareness?
- 2. To what extent does interactive navigation enhance user engagement and reduce cognitive load compared to static instructional formats?
- 3. Which tutorial format provides the most effective balance between usability, operational accuracy, and user confidence?
- 4. How do onboarding tutorials influence users’ mental models, as reflected by self-assessed understanding and safety awareness before and after the onboarding phase?
These questions serve as the foundation for a structured evaluation of tutorial effectiveness, bridging the gap between design features and user experience outcomes.
3. 2. Experimental Design
The experimental design of this research was aimed at evaluating the effects of tutorial format and navigation freedom on Inexperienced users’ learning outcomes, cognitive load, and engagement when interacting with EV charging systems. By carefully controlling tutorial content while varying the media format and navigation structure, the research sought to isolate the impact of these variables on user experience and task performance.
The tutorials were developed based on a high-usage EV charging station design widely used in Japan, chosen for its representativeness and familiarity in the target user context. Each tutorial included identical instructional content, such as safety precautions, operational steps, and process explanations. This consistency in content ensured that the media format and navigation structure were the only independent variables in the experiment. Three tutorial variants were designed to represent distinct approaches to onboarding: Illustrated, Scrolling, and Interactive.
The Illustrated Tutorial consisted of three A4-sized single-sided pages, with content arranged in a left-to-right reading order (Figure 1). It combined textual instructions with visual aids, including diagrams and icons, to enhance comprehension and reduce cognitive load. Designed as a static medium, the Illustrated tutorial required users to rely solely on their own pace and reading sequence without any digital navigation support.
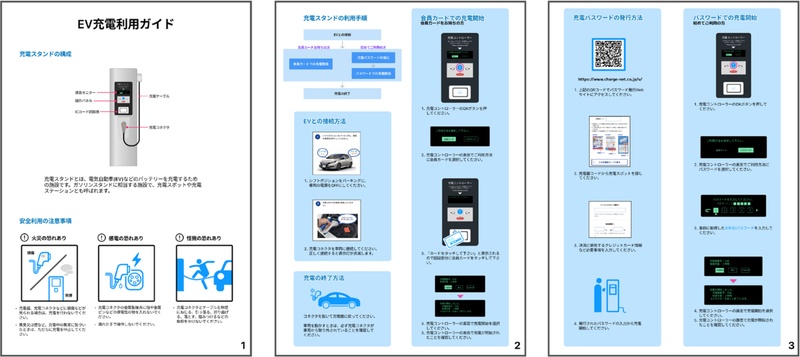
Illustrated Tutorial
This tutorial reflected traditional paper-based onboarding approaches and was particularly suited for outdoor EV charging contexts, where digital interfaces might not always be available. The structured layout followed cognitive load theory by integrating text and visuals, reducing the cognitive effort required to understand complex operational processes. However, its lack of interactivity limited its adaptability to individual user needs or preferences, making it a benchmark for comparing against more interactive variants.
The Scrolling Tutorial, adapted for smartphones, translated the content of the Illustrated tutorial into a vertically scrolling format (Figure 2). Users could swipe through the content in a fixed sequence, ensuring a clear and linear flow of information. The smartphone-based design was selected for its portability and high penetration rate among EV users, making it a practical choice for real-world application scenarios.
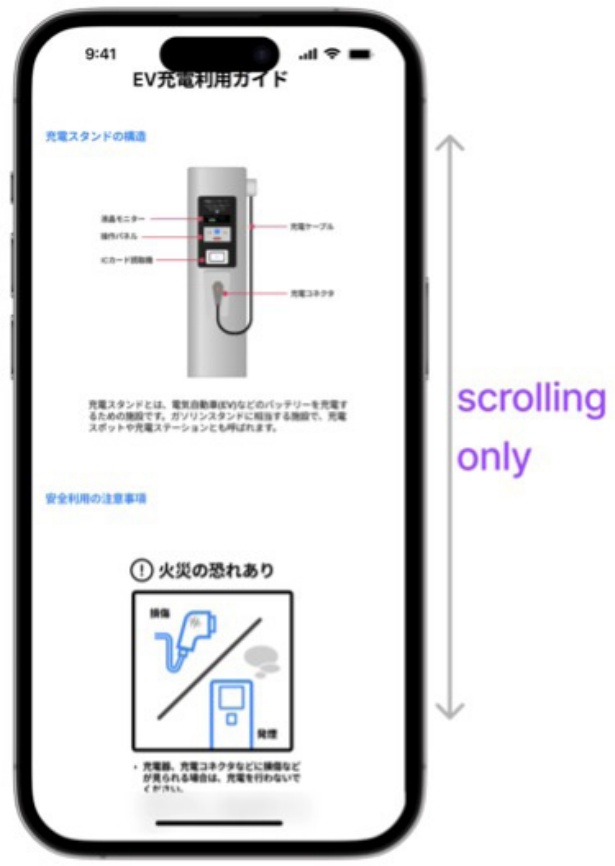
Scrolling Tutorial
While the scrolling format aligned with existing mobile-based instructional designs provided by many EV service providers, it deliberately excluded video or animation to ensure experimental control over variables. This decision addressed challenges identified in prior research, such as the impracticality of requiring users to watch animations during urgent or time-constrained tasks. The fixed navigation path reinforced sequential learning but limited users’ ability to explore content flexibly, which could affect engagement and task performance.
The Interactive Tutorial introduced a higher degree of interactivity and user control, implemented through a smartphone-based interface structured according to the Martini Glass Storytelling Metaphor (Figure 3). The Martini Glass Storytelling Metaphor (Dhanoa et al., 2022) (Figure 4) combining linear guidance during initial stages with free exploration in subsequent phases. This model addresses the dual needs of structure and autonomy, making it particularly relevant for systems requiring both operational accuracy and user engagement. In this format, users first navigated through a linear introduction to the core concepts (“stem” phase) before being allowed to explore additional details in a non-linear manner (“body” phase). The tutorial provided a main menu with options for selecting specific topics, enabling users to jump directly to areas of interest or revisit previously viewed sections. Navigation controls, such as “Next Step” and “Return to Main Menu,” further enhanced flexibility.
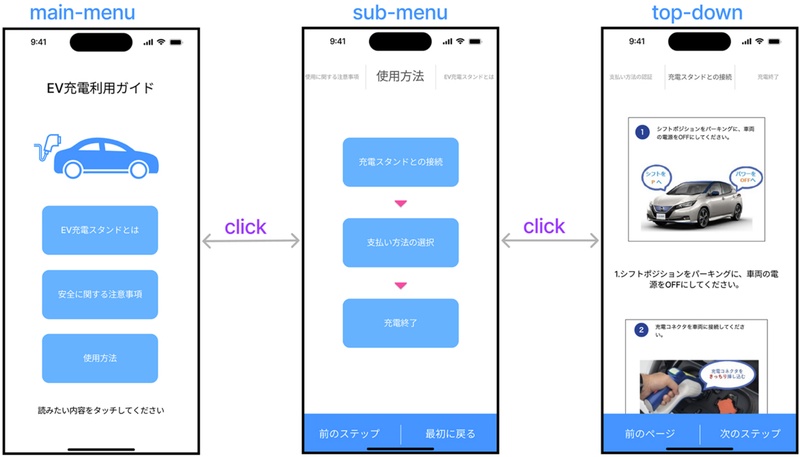
Interactive Tutorial
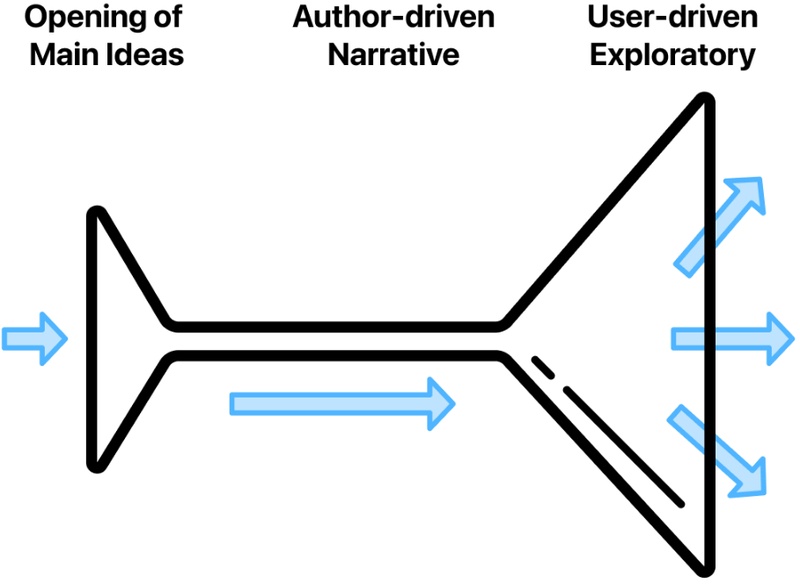
Martini Glass Storytelling Metaphor
This design aimed to simulate a real-world scenario where users might prioritize different aspects of the charging process based on their immediate needs or prior knowledge. By incorporating interactive navigation, the Interactive tutorial tested whether providing greater user autonomy would enhance learning outcomes or introduce cognitive challenges, such as decision fatigue or information overload. The design also aligned with modern user-centered interaction principles, offering personalized onboarding experiences.
The three tutorial variants were designed to address key research questions about the relationship between tutorial format, navigation freedom, and user performance. By comparing the static and fixed-sequence formats of the Illustrated and Scrolling tutorials with the dynamic, user-driven design of the Interactive tutorial, the experiment aimed to:
- 1. Evaluate how different tutorial formats affect Inexperienced users’ task completion time, error rates, and onboarding time.
- 2. Examine the influence of navigation freedom on cognitive load and engagement.
- 3. Explore whether increased interactivity improves user comprehension or inadvertently increases cognitive demands.
3. 3. Participants
The participants in this research comprised 30 individuals, all participants were Japanese students recruited from a university located in Tokyo, Japan.
The participant pool included 17 males and 13 females, with ages ranging from 20 to 25 years (mean = 22.4 years, SD = 1.4). All participants held valid driver’s licenses but reported having no prior experience using EV charging services. This ensured that the research focused on individuals unfamiliar with the operational procedures, allowing for a more accurate evaluation of the onboarding tutorials’ effectiveness in improving user comprehension and safety awareness.
The inclusion criteria—having a driver’s license and no prior experience with EV charging—were established to create a realistic testing scenario that reflects the challenges faced by Inexperienced users. This participant group represents young adults with high adaptability to technology, making them an ideal demographic for assessing onboarding tutorial design.
3. 4. Experimental Procedure
The experimental procedure followed four phases to ensure a structured and consistent evaluation process:
- 2. Pre-Tutorial Survey: Participants completed a questionnaire capturing their familiarity with EV charging systems, preferred instructional media, and baseline safety awareness. This step provided contextual data to interpret individual differences in performance and perception.
- 3. Onboarding Phase: Participants were randomly assigned to one of the three tutorial formats and instructed to engage with the tutorial until they felt prepared for the task simulation. Onboarding Time was recorded for each participant.
- 4. Task Simulation: Using a mock EV charging interface, participants performed a series of operational tasks. Task Completion Time and Error Clicks were recorded during this phase to assess operational efficiency and usability.
- 5. Post-Tutorial Assessment: After completing the simulation, participants rated their tutorial experience on cognitive load and engagement metrics. They also completed a comprehension test and participated in a brief interview to provide qualitative feedback.
The experiment was conducted in a quiet, well-lit room with only the participant and the experimenter present, ensuring a focused environment (Figure 5). Participants were asked to imagine themselves as an inexperience users and proceed at their own pace while interacting with the tutorials.
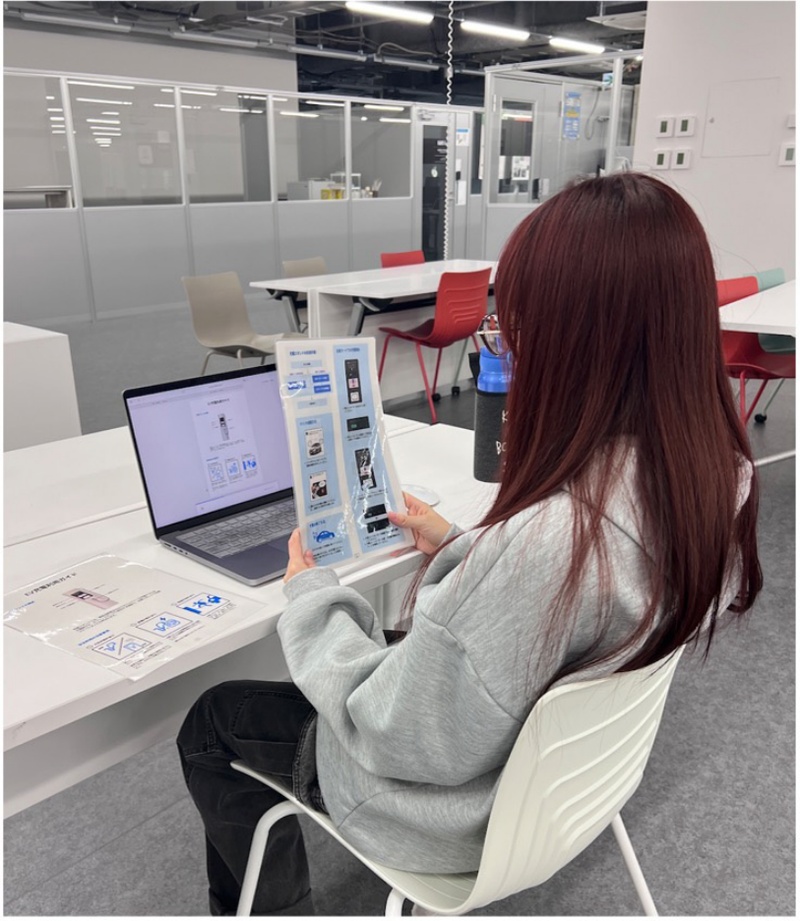
Experimental Environment
The materials included paper-based tutorials and electronic tutorials deployed on iPhones, which all participants were familiar with. A 13-inch MacBook Pro was used to administer questionnaires and simulate EV charging tasks. Data collection was automated via an online usability testing platform, which recorded onboarding time, task completion time, and error clicks using built-in timers and screen recording.
3. 5. Data Analysis
To evaluate the effectiveness of the three tutorial formats, the study collected behavioral, self-reported, and verbal feedback data. The metrics covered task performance, cognitive responses, learning outcomes, and user perceptions.
Behavioral Metrics included:
- 1. Onboarding Time: Time measured from the start of the tutorial until participants initiated the operational task.
- 2. Task Completion Time: Time taken to complete a simulated EV charging task based on a prototype modeled on a widely used Japanese EV charging interface.
- 3. Error Clicks: Number of incorrect actions recorded during the task, including misselections of charging parameters or navigational mistakes deviating from the optimal task flow.
Self-reported Metrics were collected using Likert-scale questionnaires:
- 4. Cognitive Load: Measured across four dimensions—Perceived Simplicity, Mental Demand, Effort, and Frustration.
- 5. User Engagement: Evaluated through four additional factors—Engagement, Enjoyment, Interest, and Confidence.
- 6. Self-Assessment Scores: Participants reported their own understanding and safety awareness levels before and after onboarding.
Verbal Feedback:
In addition, participants completed a comprehension test immediately after onboarding, consisting of five multiple-choice questions on EV charging steps and safety protocols. Qualitative feedback was also obtained through short post-task interviews. Participants were asked about tutorial clarity, difficulties encountered, and suggestions for improvement.
These responses were used to contextualize the quantitative findings.
Given the small sample size and violation of normality in several data distributions, nonparametric statistical methods were employed to analyze group differences.
- • Wilcoxon signed-rank tests were used to compare participants’ self-assessed understanding and safety awareness before and after onboarding.
- • Kruskal-Wallis H tests were conducted to evaluate differences among the three tutorial groups on onboarding time, task completion time, error clicks, comprehension test scores, and subjective ratings.
- • Steel-Dwass post hoc tests were used for non-parametric pairwise comparisons when Kruskal-Wallis tests showed significant effects.
- • Effect sizes and confidence intervals were calculated where applicable to support the interpretation of practical significance.
The analysis was conducted using JMP Pro 14. Qualitative data from interviews were thematically coded and analyzed using open and axial coding techniques. Recurring themes related to perceived usability, information flow clarity, and emotional responses were identified to complement the statistical results.
3. 6. Ethical Considerations
All procedures of this research are complied with ethical standards for research involving human participants. All participants were informed of the research objectives and their right to withdraw at any time without penalty. Written informed consent was obtained prior to participation. All data were used solely for the purposes of this study. Upon completion, participants were debriefed on the nature and findings of the research.
4. Results
4. 1. Self-assessed Measures
To assess participants perceived readiness and confidence regarding EV charging procedures, self-assessment ratings of both safety awareness and conceptual understanding were collected before and after onboarding (Figure 6).
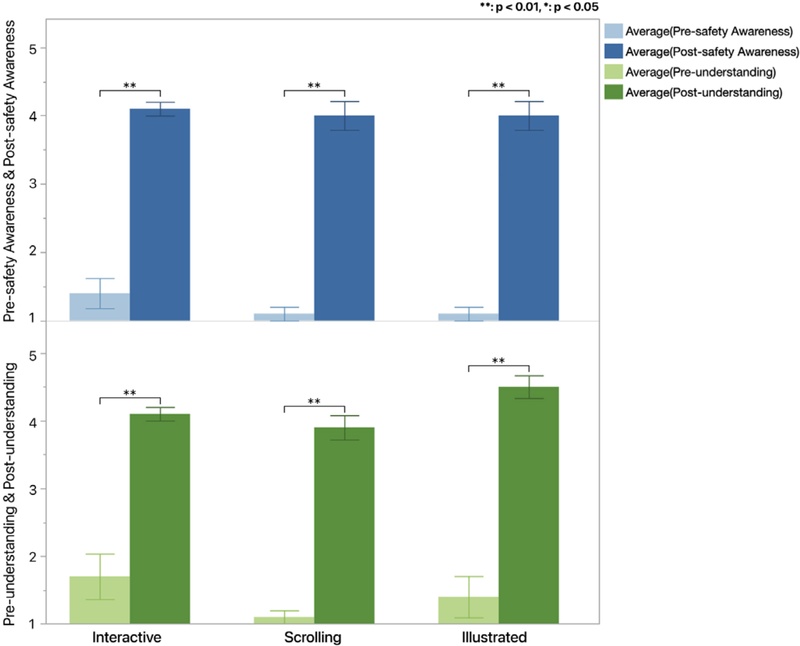
Results of self-assessment of EV charging services (top: safety awareness, bottom: understanding)
Participants reported a significant increase in perceived safety awareness following the tutorials. A Wilcoxon signed-rank test confirmed a statistically significant difference between pre- and post-onboarding scores (Post: Mdn = 3.00, Pre: Mdn = 0.20, S = 232.5, p < .0001), indicating that the onboarding experience effectively enhanced participants’ awareness of safety-related aspects.
However, a Kruskal-Wallis test on the post-intervention safety awareness scores revealed no statistically significant difference among the three tutorial conditions (χ² (2) = 0.1904, p = 0.9092). This suggests that while onboarding generally improved safety awareness, the format of the tutorial had minimal effect on this particular outcome. A similar trend was observed in self-assessed understanding. The Wilcoxon signed-rank test showed a highly significant increase in post-onboarding ratings (Post: Mdn = 3.17, Pre: Mdn = 0.40, S = 232.5, p < .0001), reflecting improved comprehension of charging concepts after tutorial completion.
Unlike safety awareness, however, a Kruskal-Wallis test revealed a significant difference in post-understanding scores across the three tutorial conditions (χ² (2) = 6.61, p = 0.0367). Steel-Dwass pairwise comparisons did not yield statistically significant differences between any specific pairs (all p > .05), although descriptive rankings suggested that the Illustrated group (Mdn ≈ 4) outperformed the Scrolling (Mdn ≈ 3) and Interactive (Mdn ≈ 3) groups. These results indicate that the structure of the tutorial may have influenced perceived comprehension, with the Illustrated format showing a slight advantage.
Participants evaluated their cognitive and emotional experiences during the onboarding process using two validated sets of self-report scales. The first measured perceived cognitive load through four dimensions: Simplicity, Mental Demand, Effort, and Frustration (Figure 7). The second assessed user engagement, encompassing Enjoyment, Interest Level, Confidence, and overall Engagement (Figure 8). Group-level differences in post-onboarding scores were analyzed using Kruskal-Wallis H tests, followed by Steel-Dwass pairwise comparisons when applicable.
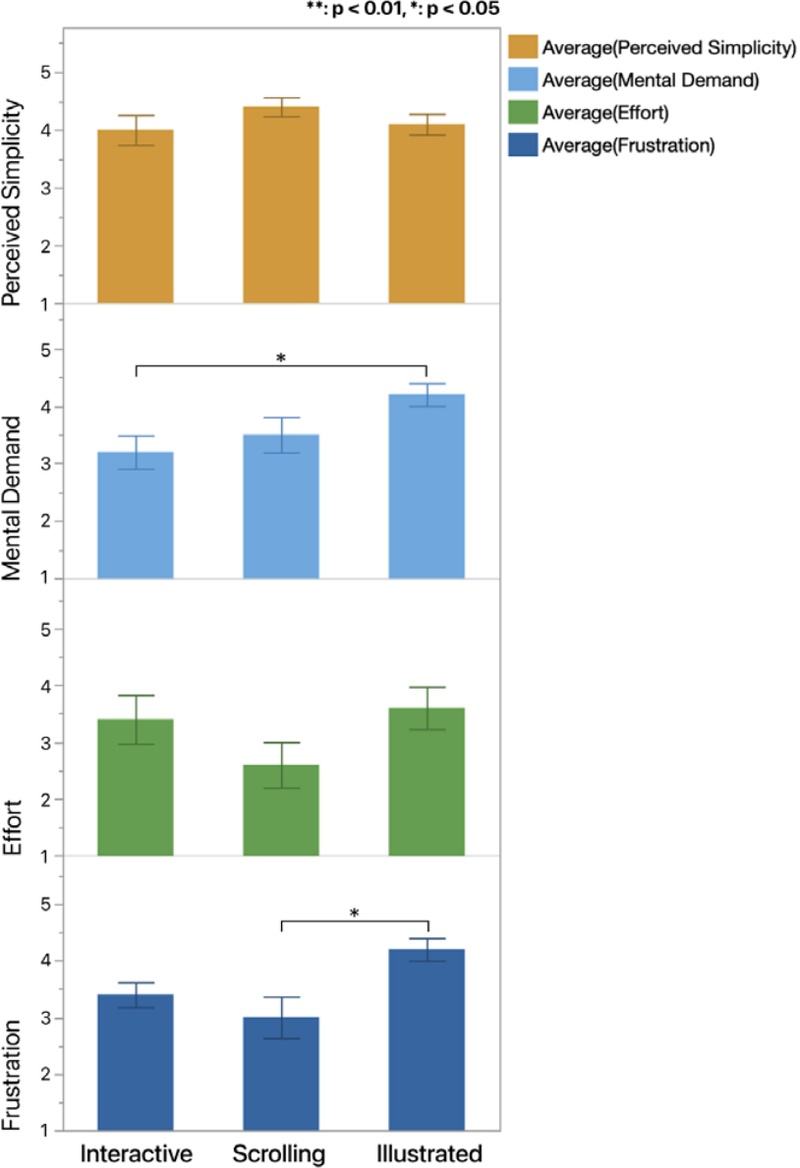
Scores of Subjective Evaluations after Onboarding Related to Cognitive Load
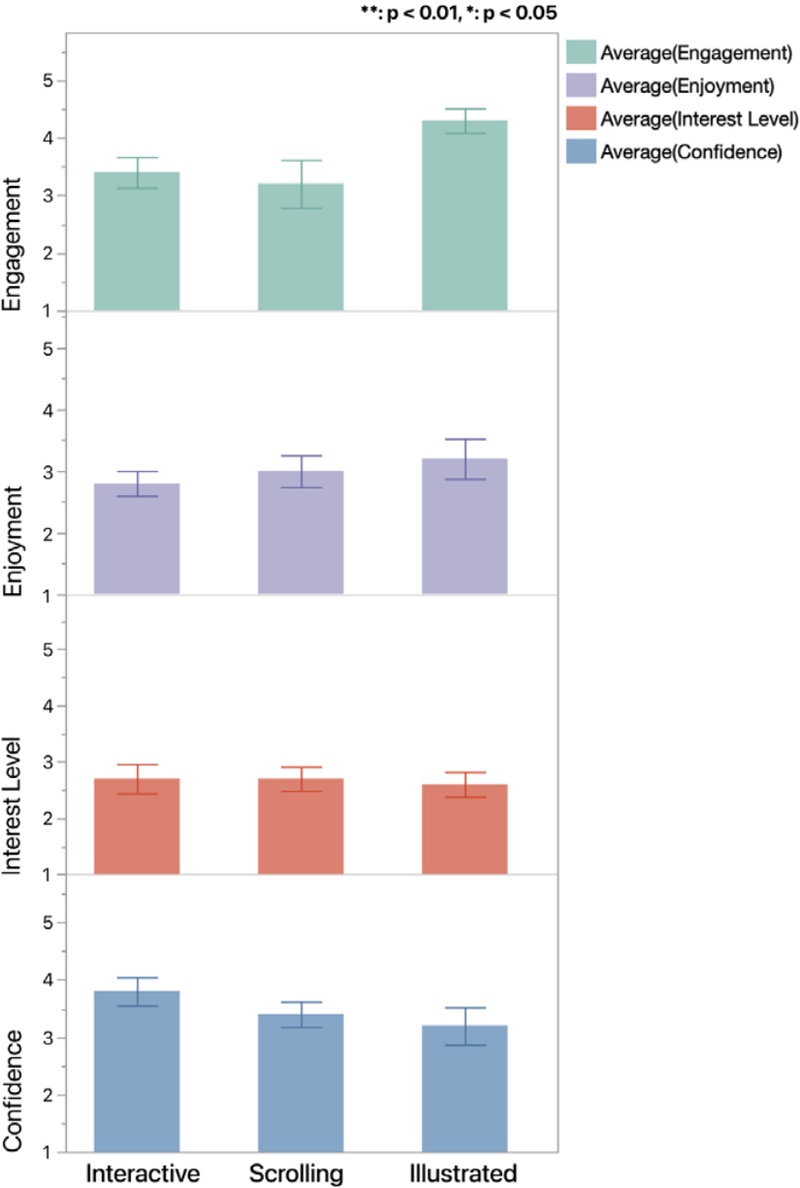
Scores of Subjective Evaluations after Onboarding Related to Engagement
No significant group differences were found for Perceived Simplicity (χ² (2) = 1.84, p = .3986) or Effort (χ² (2) = 3.65, p = .1614), suggesting that the tutorials did not vary substantially in their perceived ease or required physical/mental exertion.
However, significant differences were observed in Mental Demand (χ² (2) = 6.46, p = .0395). A Steel-Dwass comparison indicated that the Illustrated tutorial elicited significantly greater mental demand than the Interactive tutorial (Z = 2.43, p = .0403), while the difference with the Scrolling group was not significant (p = .2183). This suggests that the Illustrated tutorial may have required higher levels of concentration, possibly due to its reliance on self-guided interpretation.
In addition, significant group differences were found for Frustration (χ² (2) = 7.88, p = .0195). The Illustrated group reported significantly higher frustration levels than the Scrolling group (Z = 2.41, p = .0422), while no significant differences were observed between the Interactive and other groups. This may reflect cognitive overload or ambiguity encountered during static content interaction.
Among the four-engagement metrics, only overall Engagement showed a significant difference among the groups (χ² (2) = 6.25, p = .0440). Although none of the pairwise Steel-Dwass comparisons reached the Bonferroni-adjusted threshold (all p > .05), the Illustrated group trended toward higher engagement compared to both Interactive and Scrolling conditions.
In contrast, no significant differences were found for Enjoyment (χ² (2) = 0.86, p = .6517), Interest Level (χ² (2) = 0.13, p = .9356), or Confidence (χ² (2) = 2.82, p = .2442), indicating that despite variations in cognitive demand, participants across conditions generally maintained similar affective responses.
4. 2. Task-Based Performance
The Kruskal-Wallis H test revealed a significant difference in onboarding time across the three tutorial conditions (χ² (2) = 7.52, p = .0232) (Figure 9). According to Steel-Dwass pairwise comparisons, participants in the Illustrated group required significantly more time to complete the tutorial and initiate the task than those in the Interactive group (Z = 2.38, p = .0454). No statistically significant differences were found between the Illustrated and Scrolling groups (p = .0660), or between Scrolling and Interactive groups (p = .9508). These findings suggest that the Illustrated tutorial, which required self-paced reading and interpretation, may have imposed a greater cognitive or attentional demand compared to the more interactive tutorial, thereby increasing the time users needed to feel adequately prepared.
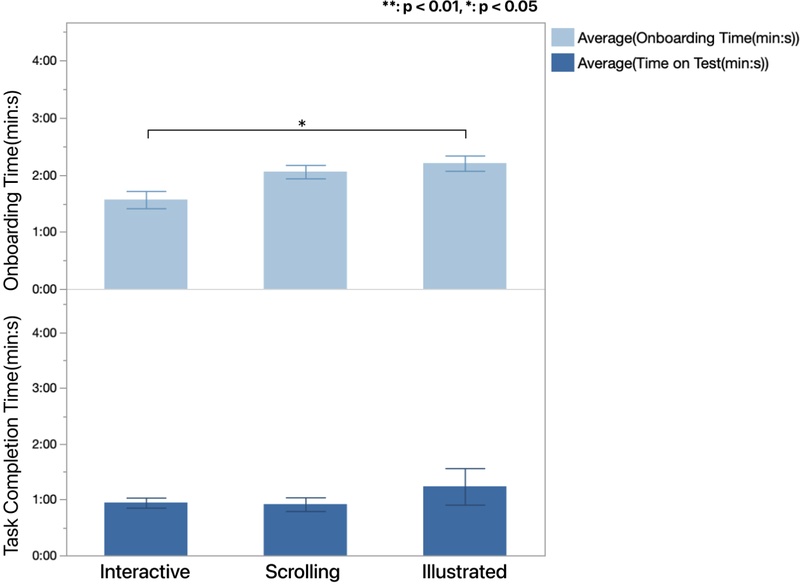
Onboarding Time and Task Completion Time
In contrast, no significant group differences were found in the time participants took to complete the actual charging simulation task (χ² (2) = 1.17, p = .5570). This suggests that, regardless of the tutorial type, participants performed similarly once they had begun the operational task. The comparable task times may reflect a learning ceiling effect or indicate that all tutorials effectively conveyed the minimum required procedural knowledge.
Taken together, these results indicate that the format of the onboarding tutorial influences the time needed to prepare, but not necessarily the efficiency of task execution. The active tutorial appears to support more efficient onboarding without compromising later performance.
To evaluate how effectively each tutorial format supported both procedural learning and interface mastery, this section examines two outcome indicators: comprehension accuracy and operational errors during task execution.
Participants completed a five-item multiple-choice test designed to assess their understanding of key concepts in EV charging after the onboarding phase. A Kruskal-Wallis test revealed a marginal group-level difference in test scores (χ² (2) = 5.70, p = .0577), suggesting a potential trend toward tutorial-dependent knowledge acquisition (Figure 10).
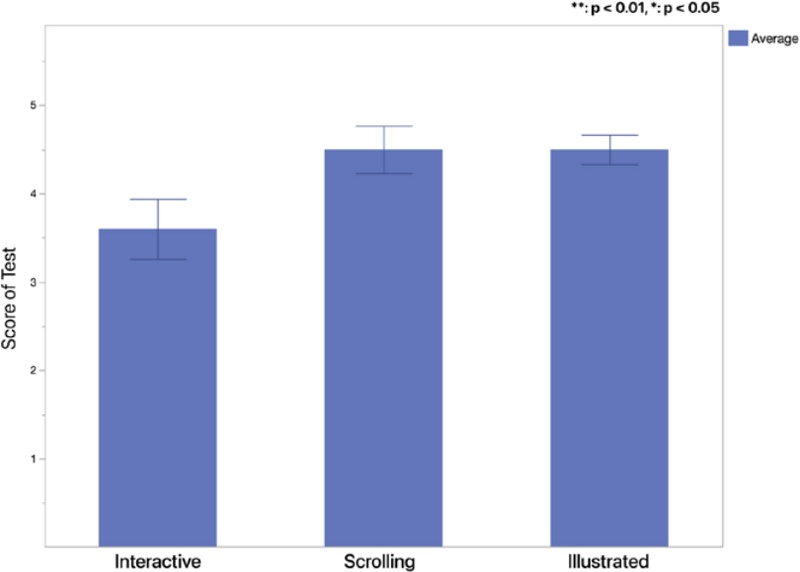
Score of Test after Onboarding
Descriptively, the Scrolling group achieved the highest median score (Mdn ≈ 5), followed by the Illustrated group (Mdn ≈ 4), with the active group performing lowest (Mdn ≈ 3). While these results did not reach statistical significance under the conventional threshold (p < .05), they may reflect the Illustrated and Scrolling formats’ clearer or more structured information delivery compared to the more exploratory active format.
In contrast, the Kruskal-Wallis test for the number of operational errors revealed a statistically significant difference among tutorial conditions (χ² (2) = 7.48, p = .0237) (Figure 11). Steel-Dwass pairwise comparisons showed that the Scrolling group committed significantly more errors during the task than the Illustrated group (Z = 2.64, p = .0224), while the other comparisons were not significant.
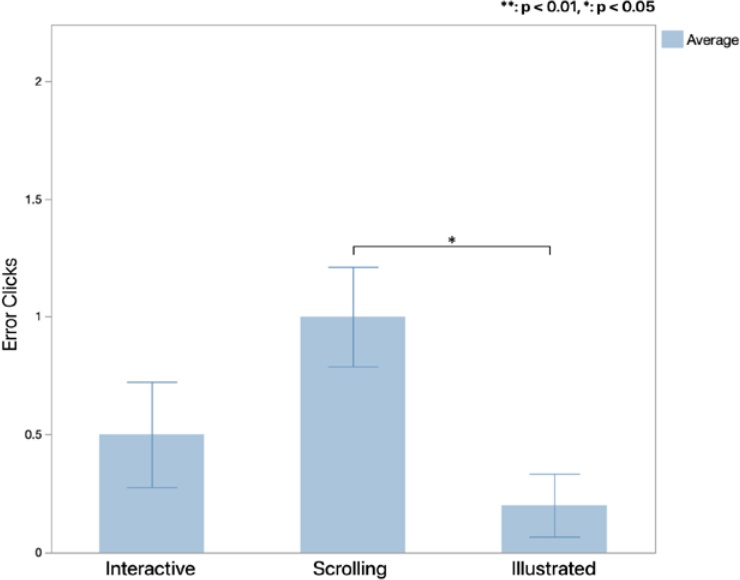
Errors Clicks in Operational Simulation
These findings suggest that despite scoring higher on conceptual understanding, participants exposed to the Scrolling tutorial may have experienced weaker procedural transfer or encountered more uncertainty during interface interaction, resulting in increased mis-clicks. Conversely, the Illustrated tutorial appeared to offer both conceptual clarity and operational stability, likely due to its explicit structure and visual guidance.
Taken together, these results indicate a potential gap between understanding and action, emphasizing that onboarding tutorials must address both declarative knowledge and interactive affordances to ensure successful task performance.
4. 3. Qualitative Insights
To complement the quantitative findings, post-task interviews were conducted to capture participants’ subjective experiences with the onboarding tutorials. Thematic analysis was conducted through open and axial coding of post-interview transcripts. Key concepts such as clarity of instructions, ease of navigation, emotional reassurance, and content comprehension emerged during open coding, and were subsequently grouped under tutorial-specific themes for axial organization (Table 1).

Participant Feedback on Usability and Improvements of EV Charging Tutorials
• Scrolling Tutorial
Participants appreciated the visual simplicity and beginner-friendly format of the Scrolling tutorial. The use of icons and illustrations aided comprehension, particularly for first-time users. Safety instructions were perceived as clear and well-organized.
However, several users reported difficulty understanding how to retrieve charging passwords, locate relevant UI components, and follow decision-making sequences. Suggestions for improvement included adding a table of contents, using multimedia aids like videos, and clearly highlighting critical steps.
• Interactive Tutorial
The Interactive tutorial was noted for its engaging design, including realistic photos and dynamic layouts. Some participants found the vertical scrolling interface intuitive and helpful in reducing cognitive load. Speech bubbles and creative visual elements were credited with enhancing the user experience.
Nevertheless, the interaction-heavy format also introduced confusion, particularly in locating information or following non-linear screen transitions. Participants suggested simplifying transitions, clarifying progress indicators, and emphasizing next-step guidance.
• Illustrated Tutorial
Participants generally described the Illustrated tutorial as reassuring and easy to refer to during the charging process. The clear structure, concise explanations, and sequential layout were praised for enhancing understanding. Placing safety instructions at the beginning was seen as particularly effective. Some participants, however, found it harder to visualize dynamic interactions or interpret procedural elements without supplemental visual aids. Improvements were suggested in terms of better guiding attention and highlighting key sections.
5. Discussion
5. 1. Overview of Key Findings
This research investigated the comparative effectiveness of three onboarding tutorial types—Illustrated, Interactive, Scrolling and—in supporting inexperienced users of electric vehicle (EV) charging systems. These tutorials differ not only in interface presentation but also in cognitive demands, navigational control, and interactive feedback. Table 2 summarizes their core design characteristics alongside key cognitive and performance outcomes identified in this study, including cognitive load, task accuracy, and user engagement. Each tutorial demonstrated distinctive combinations of design features and corresponding performance outcomes.
Comparison of EV Charing Tutorial Interfaces
The Illustrated tutorial, characterized by its linear stepwise layout and rich visual support, induced higher cognitive load, as participants had to memorize and mentally rehearse task steps. However, this structure facilitated greater task accuracy and fewer operational errors, making it effective for procedural retention despite its cognitive demands.
In contrast, the Interactive tutorial, with its modular navigation and dynamic feedback, achieved the shortest onboarding time and the highest user engagement scores, particularly in interest and attention. Yet, its nonlinear structure introduced navigation confusion for some participants, and comprehension scores were more variable.
The Scrolling tutorial, offering a linear content flow with limited interactivity, was perceived as visually simple and user-friendly, but yielded higher error rates and moderate engagement levels. Participants noted difficulties in locating specific steps and understanding progression cues.
Together, these results reveal that onboarding tutorial design influences not only usability and engagement, but also how well users retain and apply procedural knowledge. Importantly, our findings do not support the assumption that the Interactive tutorial is universally superior to static formats; rather, each tutorial demonstrates differentiated strengths across accuracy, engagement, and cognitive effort. Consequently, the choice of onboarding format should be made contingently aligned with the primary goal (e.g., safety/accuracy vs. motivation/interest vs. quick orientation) instead of pursuing a single “best” design. In addition, self-reports indicated improvements in understanding and safety awareness from pre- to post-onboarding, reinforcing that tutorial structure can shape users’ confidence and risk perception.
5. 2. Implications for EV Onboarding Tutorial Design
The structural design of onboarding tutorials plays a pivotal role in shaping users’ cognitive load and learning performance. As illustrated in Figure 12, the three tutorial types present fundamentally distinct information flow architectures that directly influence how users process instructional content and transition to task execution.
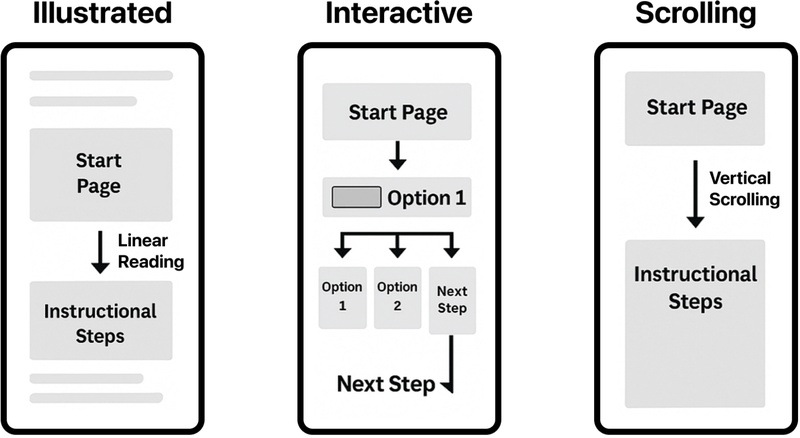
Information Flow of 3 Types of Tutorials
The Illustrated tutorial follows a highly linear structure, presenting information sequentially from top to bottom with minimal opportunities for navigation or interaction. This constrained format requires users to cognitively retain step-by-step instructions until they transition to the operational task. According to Cognitive Load Theory (Sweller, 1988), this places a significant demand on working memory, particularly due to the split-attention effect—users must mentally integrate static visual content with upcoming motor tasks without scaffolded reinforcement. The results corroborate this: participants in the Illustrated condition reported the highest levels of mental and physical demand, and experienced longer onboarding times, yet they also demonstrated higher task accuracy and comprehension scores. These findings suggest that although the linear format induces cognitive strain, it may promote deeper encoding of procedural knowledge when users are motivated to engage. This deeper encoding likely underpins higher confidence at the point of task execution and contributes to elevated post-onboarding safety awareness.
In contrast, the Interactive tutorial offers a modular and interactive experience. Users are allowed to freely explore sections of the tutorial using swipe gestures, with dynamic visual cues reinforcing their progress. This structure promotes learner control, which has been shown to enhance engagement and attention (Mayer, 2005). Participants in the Interactive condition reported higher interest, curiosity, and attentional focus, consistent with an affectively rich onboarding experience. However, performance metrics revealed only moderate comprehension accuracy and a non-negligible error rate during task execution. The evidence indicates that increased user control raises engagement but may fragment procedural schemas when sequencing is not strongly scaffolded, thereby limiting gains in accuracy and confidence.
The Scrolling tutorial resides in the middle of this continuum. It presents animated transitions in a fixed flow with limited interactivity (e.g., scrolling only), providing a semi-structured experience. Participants rated it as easy to follow and visually intuitive but also exhibited a comparatively higher rate of operational errors. This implies that while the Scrolling design lowers extraneous load through automation and visual flow, it may not adequately foster active construction of mental models necessary for correct task translation. Taken together, the design feature analysis indicates that tutorials optimized for engagement are not always aligned with those that maximize task accuracy. The Illustrated tutorial demands more cognitive effort upfront but supports precise procedural understanding. The Interactive tutorial enhances user interest and navigation satisfaction but risks cognitive overload due to fragmented control. The Scrolling tutorial offers a comfortable experience but may underperform in transferring declarative content into procedural action. Accordingly, Scrolling is better positioned for quick familiarization rather than for safety-critical mastery. In summary, illustrated tutorials are most appropriate when safety and operational accuracy are the primary goals; Interactive tutorials are advantageous when the objective is to increase motivation and sustained attention; Scrolling tutorials suffice for low-stakes orientation or quick familiarization. Designers should therefore select the tutorial format conditionally, according to context-specific priorities rather than expecting a universally superior solution. In the EV-charging context, the most actionable path is a hybrid strategy that retains the Illustrated tutorial’s structured narrative while adding minimal, well-placed interactive scaffolds (e.g., confirmations/progress cues), thereby balancing accuracy and confidence with motivational engagement.
While the effectiveness of onboarding systems has been extensively explored in domains such as data visualization dashboards (Dhanoa et al., 2022; Stoiber et al., 2019) and technical assembly training (Javornik et al., 2020), limited work has addressed the onboarding needs for physical-digital hybrid services like EV charging stations. Our study contributes to this gap by examining how tutorial structure and interactivity influence first-time users’ comprehension, confidence, and task performance.
Dhanoa et al. (2022) proposed a cyclical “Onboarding Loop” process model in dashboard design, where initial exploration, user reflection, and iterative understanding are scaffolded through interface affordances. In contrast, our findings reveal that onboarding for EV charging—a safety-critical, one-time task—demands a more constrained flow structure. The linearity of the Illustrated tutorial, despite limiting user control, reduced error frequency and improved understanding among novices. This contrasts with findings in visualization onboarding, where exploratory freedom often enhances engagement and retention. Thus, while Dhanoa’s model favors open-ended interaction, our results highlight the necessity of structured, cognitively supportive flows in task-specific onboarding.
Similarly, Stoiber et al. (2019) proposed the six-dimensional design space (Why-What-Who-How-Where-When) for onboarding narratives. Our study implicitly touches on several of these dimensions—most notably the “How” (flow structure) and “When” (sequencing). In line with Stoiber’s argument for tailored onboarding strategies, our results show that excessive interactivity (as seen in the Interactive tutorial) may undermine performance when not guided by appropriate scaffolding. This emphasizes the contextual limits of high-control tutorial designs.
From a modality perspective, Javornik et al. (2020) compared AR-based and paper-based instructions for manual assembly, demonstrating that spatial and temporal integration of information enhances task efficiency. Our study complements this by showing that even in low-tech environments, UI design that emphasizes step-by-step flow and minimal cognitive load can support learning transfer. The findings caution against assuming that interactive or digital tutorials are inherently superior—especially when safety, reliability, and low user error are priorities.
5. 3. Practical Design Considerations
The findings of this research suggest a need for carefully balancing cognitive support, user control, and safety-critical learning outcomes when designing onboarding tutorials for EV charging systems. While digital interaction is often associated with improved engagement, our results emphasize that excessive user freedom—especially in Inexperienced safety-oriented operations—can increase operational errors and reduce comprehension.
For practical design, we suggest the following considerations:
• Prioritize Step-by-Step Structure in Critical Tutorials
For services involving physical actions and safety risks (e.g., connecting high-voltage EV chargers), onboarding materials should favor structured flows with clear progression indicators rather than open-ended exploration.
• Optimize Interactivity for Novice Users
While user agency is important, it should not come at the expense of clarity. Interfaces for inexperienced users should limit unnecessary navigational freedom and provide timely confirmation checkpoints or visual cues to maintain learning continuity.
• Use Visual Scaffolding to Reinforce Key Concepts
Based on our analysis, visual segmentation of instructional content into discrete blocks (e.g., numbered steps, icon-labeled warnings) supports memory encoding and reduces the risk of information overload.
• Align Tutorial Modality with Task Context
For environments lacking real-time feedback (e.g., public EV chargers with minimal UI), Illustrated or fixed-sequence digital tutorials may offer a more reliable path to safe task completion.
• Design for Error Prevention Rather Than Recovery
Unlike digital dashboards where mistakes can be reversed, physical systems like EV chargers demand error-proof design. Onboarding tutorials should thus anticipate user misconceptions and proactively correct them through constrained interaction.
These considerations extend beyond EV charging to other domains where onboarding experiences bridge physical and digital actions, such as public kiosks, self-checkout stations, and medical self-testing devices. Designers should calibrate tutorial complexity not only to user proficiency, but also to task criticality and environmental constraints.
5. 4. Limitations and Future Work
This study presents insights into onboarding tutorial design; however, all participants were Japanese university students residing in Japan at the time of the study, with relatively high digital literacy, and the experiment was conducted in a controlled setting using a prototype modeled on a widely used Japanese EV-charging interface. The tutorials were static text-and-image materials without multimedia or adaptive features. These constraints enabled fair cross-condition comparisons but limit ecological validity and generalizability.
Building on these findings, future studies should broaden participant demographics, conduct field studies in real stations to capture environmental pressures, and examine dynamic instructional elements (e.g., real-time feedback, lightweight AR overlays) that may reduce reliance on pre-learning. Longitudinal research can assess retention and transfer to unfamiliar chargers; adaptive onboarding systems that modulate flow and redundancy based on user behavior are a promising direction.
Finally, future work should move beyond the search for a universally optimal format and instead identify conditionally optimal strategies—i.e., which tutorial design yields the best balance of accuracy, confidence, and engagement under specific operational constraints.
Notes
Copyright : This is an Open Access article distributed under the terms of the Creative Commons Attribution Non-Commercial License (http://creativecommons.org/licenses/by-nc/3.0/), which permits unrestricted educational and non-commercial use, provided the original work is properly cited.
References
- Abe, T. (2015). EV charging infrastructure system that facilitates commercialization of EV charging. NEC Technical Journal, 10(1). https://www.nec.com/en/global/techrep/journal/g15/n01/g1501pa.html.
-
Angeli, C., & Valanides, N. (2004). Examining the effects of text-only and text-and-visual instructional materials on the achievement of field-dependent and field-independent learners during problem-solving with modeling software. Educational Technology Research and Development, 52(4), 23-36.
[https://doi.org/10.1007/BF02504715]

-
Chandler, P., & Sweller, J. (1991). Cognitive load theory and the format of instruction. Cognition and Instruction, 8(4), 293-332.
[https://doi.org/10.1207/s1532690xci0804_2]
- Chiappetta, A. (2020). Designing effective user onboarding experiences for mobile applications [Master's thesis, Politecnico di Milano]. https://www.politesi.polimi.it/handle/10589/175204.
-
Clayton, W. (2022). Becoming an electric car owner: User experience and the EV community. Transport and Sustainability, 15, 135-157.
[https://doi.org/10.1108/S2044-994120220000015010]
-
Crouse, M. D. (2024). Learning to direct attention: Consequences for procedural task training programs. Acta Psychologica, 250, 104502.
[https://doi.org/10.1016/j.actpsy.2024.104502]
-
Detjen, H., Degenhart, R. N., Schneegass, S., & Geisler, S. (2021). Supporting user onboarding in automated vehicles through multimodal augmented reality tutorials. Multimodal Technologies and Interaction, 5(5), 22.
[https://doi.org/10.3390/mti5050022]
-
Dhanoa, V., Walchshofer, C., Hinterreiter, A., Stitz, H., Gröller, E., & Streit, M. (2022). A process model for dashboard onboarding. Computer Graphics Forum, 41(3), 501-513.
[https://doi.org/10.1111/cgf.14558]
-
Dhanoa, V., Hinterreiter, A., Fediuk, V., Elmqvist, N., Gröller, E., & Streit, M. (2024). D-tour: Semi-automatic generation of interactive guided tours for visualization dashboard onboarding. IEEE Transactions on Visualization and Computer Graphics.
[https://doi.org/10.31219/osf.io/t5m3u]
-
Doi, T., Yamamoto, S., Seto, D., & Shimizu, Y. (2024). Effects of conceptual information about mechanism for operating manual on user's product comprehension: Comparison of effectiveness of paper manual and video manual. Journal of the Science of Design, 71(1), 1_29–1_38.
[https://doi.org/10.11247/jssdj.71.1_29]
-
Dorcec, L., Pevec, D., Vdovic, H., Babic, J., & Podobnik, V. (2019). How do people value electric vehicle charging service? A gamified survey approach. Journal of Cleaner Production, 210, 887-897.
[https://doi.org/10.1016/j.jclepro.2018.11.032]
- Eriksson, R. (2023). Improving discoverability of new functionality: Evaluating user onboarding elements and embedded user assistance for highlighting new features in a PACS [Master's thesis]. https://urn.kb.se/resolve?urn=urn:nbn:se:liu:diva-196214.
-
Fabianek, P., & Madlener, R. (2023). Multi-criteria assessment of the user experience at e-vehicle charging stations in Germany. Transportation Research Part D: Transport and Environment, 121, 103782.
[https://doi.org/10.1016/j.trd.2023.103782]
-
Fernandes, T., & Vasconcelos, A. (2021). Mobile marketing in health: User experience guiding the implementation of a medical booking application. Communications in Computer and Information Science, 1400, 541-564.
[https://doi.org/10.1007/978-3-030-72379-8_27]
-
Fernquist, J., Grossman, T., & Fitzmaurice, G. (2011). Sketch-sketch revolution: An engaging tutorial system for guided sketching and application learning. In Proceedings of the 24th Annual ACM Symposium on User Interface Software and Technology (pp. 373-382).
[https://doi.org/10.1145/2047196.2047245]
- Figenbaum, E., & Kolbenstvedt, M. (2016). Learning from Norwegian battery electric and plug-in hybrid vehicle users (TØI Report 1492/2016). Institute of Transport Economics. https://www.toi.no/getfile.php?mmfileid=43161.
-
Figenbaum, E., Wangsness, P. B., Amundsen, A. H., & Milch, V. (2022). Empirical analysis of the user needs and the business models in the Norwegian charging infrastructure ecosystem. World Electric Vehicle Journal, 13(10), 185.
[https://doi.org/10.3390/wevj13100185]
-
Filipowicz, A. L. S., Bravo, N. S., Iliev, R., Mohanty, V., Wu, C. C., & Shamma, D. A. (2023). Promoting sustainable charging through user interface interventions. In Proceedings of the ACM International Conference (pp. 267-279).
[https://doi.org/10.1145/3580585.3607176]
-
Gupta, S., & Bostrom, R. P. (2009). Technology-mediated learning: A comprehensive theoretical model. Journal of the Association for Information Systems, 10(9), 686-714.
[https://doi.org/10.17705/1jais.00207]
-
Hyun, D., Jang, E., Lee, J., & Kim, T. (2024). Green cloud: Supporting sustainable behavior by helping users remove unnecessary photos from cloud storage service. In Extended Abstracts of the CHI Conference on Human Factors in Computing Systems (pp. 1-6).
[https://doi.org/10.1145/3613905.3647968]
- Jabeen, F., Olaru, D., Smith, B., Braunl, T., & Speidel, S. (2013, October). Electric vehicle battery charging behaviour: Findings from a driver survey. In Proceedings of the Australasian Transport Research Forum (Vol. 1). https://www.researchgate.net/publication/289630885.
-
Kaushal, R. K., Jain, S., Shankar Rao, R. G., Thirumalaimuthu, B., Rawat, R., & L, N. (2023). A payment system for electric vehicles charging and peer-to-peer energy trading. In I-SMAC 2023 (pp. 984-991).
[https://doi.org/10.1109/i-smac58438.2023.10290505]
-
Sudha, S., Keshav Kolla, V., Sanchez, A., & Plapper, P. (2021). Comparing effectiveness of paper based and Augmented Reality instructions for manual assembly and training tasks. In Proceedings of the Conference on Learning Factories (CLF), Graz, Austria (Vol. 31).
[https://doi.org/10.2139/ssrn.3859970]
-
Kwon, B. C., & Lee, B. (2016). A comparative evaluation on online learning approaches using parallel coordinate visualization. In Proceedings of the CHI Conference on Human Factors in Computing Systems (pp. 993-997).
[https://doi.org/10.1145/2858036.2858101]
-
Li, C., Zhang, S., Ling, W., Zhao, L., & Pan, Y. (2024). Enhancing user experience in electric vehicle charging applications (EVCA): A comprehensive analysis in the Chinese context. Journal of the Knowledge Economy, 1-36.
[https://doi.org/10.1007/s13132-024-01881-5]
-
Mayer, R. E. (2009). Multimedia learning (2nd ed.). Cambridge University Press.
[https://doi.org/10.1017/CBO9780511811678]
-
Mayer, R. E., & Chandler, P. (2001). When learning is just a click away: Does simple user interaction foster deeper understanding of multimedia messages? Journal of Educational Psychology, 93(2), 390-397.
[https://doi.org/10.1037/0022-0663.93.2.390]
-
Mayer, R. E., Hegarty, M., Mayer, S., & Campbell, J. (2005). When static media promote active learning: Annotated illustrations versus narrated animations in multimedia instruction. Journal of Experimental Psychology: Applied, 11(4), 256-265.
[https://doi.org/10.1037/1076-898x.11.4.256]
-
O'Brien, H. L., & Toms, E. G. (2008). What is user engagement? A conceptual framework for defining user engagement with technology. Journal of the American Society for Information Science and Technology, 59(6), 938-955.
[https://doi.org/10.1002/asi.20801]
-
Oyedele, A., & Simpson, P. M. (2007). An empirical investigation of consumer control factors on intention to use selected self-service technologies. International Journal of Service Industry Management, 18(3), 287-306.
[https://doi.org/10.1108/09564230710751497]
-
Palmiter, S., & Elkerton, J. (1993). Animated demonstrations for learning procedural computer-based tasks. Human-Computer Interaction, 8(3), 193-216.
[https://doi.org/10.1207/s15327051hci0803_1]
-
Petersen, F. W., Thomsen, L. E., Mirza-Babaei, P., & Drachen, A. (2017). Evaluating the onboarding phase of free-to-play mobile games: A mixed-method approach. In Proceedings of the Annual Symposium on Computer-Human Interaction in Play (CHI PLAY' 17) (pp. 377-388).
[https://doi.org/10.1145/3116595.3125499]
- Schneider, M. (n.d.). Interface usability testing to maximize user onboarding experience. PlotProjects-Geofencing Notifications for apps. Retrieved April 2, 2024, from https://www.academia.edu/28449519/INTERFACE_USABILITY_TESTING_TO_MAXIMIZE_USER_ONBOARDING_EXPERIENCE.
-
Soong, K., Fu, X., & Zhou, Y. (2019). Optimizing new user experience in online services. In Proceedings of the 2018 IEEE International Conference on Data Science and Advanced Analytics (DSAA 2018) (pp. 442-449).
[https://doi.org/10.1109/DSAA.2018.00057]
-
Stoiber, C., Grassinger, F., Pohl, M., Stitz, H., Streit, M., & Aigner, W. (2019). Visualization onboarding: Learning how to read and use visualizations.
[https://doi.org/10.31219/osf.io/c38ab]
-
Stoiber, C., Walchshofer, C., Grassinger, F., Stitz, H., Streit, M., & Aigner, W. (2021). Design and comparative evaluation of visualization onboarding methods. In Proceedings of the ACM International Conference.
[https://doi.org/10.1145/3481549.3481558]
-
Strahm, B., Gray, C. M., & Vorvoreanu, M. (2018). Generating mobile application onboarding insights through minimalist instruction. In Proceedings of the 2018 Designing Interactive Systems Conference (DIS' 18) (pp. 361-372).
[https://doi.org/10.1145/3196709.3196727]
-
Sweller, J. (2010). Element interactivity and intrinsic, extraneous, and germane cognitive load. Educational Psychology Review, 22(2), 123-138.
[https://doi.org/10.1007/s10648-010-9128-5]
-
Tanahashi, Y., Leaf, N., & Ma, K.-L. (2016). A study on designing effective introductory materials for information visualization. Computer Graphics Forum, 35(7), 117-126.
[https://doi.org/10.1111/cgf.13009]
-
van der Meij, H., & van der Meij, J. (2014). A comparison of paper-based and video tutorials for software learning. Computers & Education, 78, 150-159.
[https://doi.org/10.1016/j.compedu.2014.06.003]
-
Will, C., & Schuller, A. (2016). Understanding user acceptance factors of electric vehicle smart charging. Transportation Research Part C: Emerging Technologies, 71, 198-214.
[https://doi.org/10.1016/j.trc.2016.07.006]
-
Wogalter, M. S., Conzola, V. C., & Smith-Jackson, T. L. (2002). Research-based guidelines for warning design and evaluation. Applied Ergonomics, 33(3), 219-230.
[https://doi.org/10.1016/s0003-6870(02)00009-1]
-
Wu, H., & Yang, W. (2024). A case study on the intersection of EV charge UX and user onboarding design. In International Symposium on Affective Science and Engineering (ISASE 2024) (pp. 1-4).
[https://doi.org/10.5057/isase.2024-c000034]
-
Zhu, Z., Nakata, C., Sivakumar, K., & Grewal, D. (2007). Self-service technology effectiveness: The role of design features and individual traits. Journal of the Academy of Marketing Science, 35(4), 492-506.
[https://doi.org/10.1007/s11747-007-0019-3]