Research on the Relationship Between Interaction Performance with Barrier and Seating Layouts in the Classroom: Using the Spatial Syntax Visual Access and Exposure Model
Abstract
Background The South Korean education system encourages classrooms to create a suitable environment for active interaction and high performance. However, human behavior can differentiate depending on one’s physical surroundings in the learning space. This research explores the effect that barriers and seating layouts have on classroom design and interaction performance through spatial syntax Visual Access and Exposure (VAE) analysis.
Methods In the classroom, both instructors and students preferred having equal levels of visibility and information access with one another. Therefore, equal levels of Visual Access (VA) and Visual Exposure (VE) for each classroom inhabitant was recommended. The researcher analysed 16 types of barrier layouts for each of the 4 different standard classroom seating layouts, using VA and VE levels to determine preferable barrier designs that brought out the highest interaction performance among class participants. In total, there were 64 classroom samples, a combination of 16 variation types of barrier layouts, and 4 variation types of seating layouts, to run a VAE test.
Results The highest interaction performance classroom design was selected by the lowest ranked coefficient of variation (CV) values of VA and VE. The barrier did affect the interaction level for classroom participants, and each seating layout had different barrier recommendations. The classroom sample with a closed barrier and a hallow-shape seating arrangement had the lowest CV for VA and VE levels.
Conclusions Designing a space with an evenly distributed VA and VE level facilitates greater interaction. Thus, different barriers create a different environment to support group interaction. The data collected from this research offers a prototype design solution. Although not generally applicable to all classroom activities, the research results may be beneficial for design practitioners and space users looking to create or join an interactive and collaborative workspace. In addition, the results can provide insight into how spaces influence social relationships through human visibility.
Keywords:
Space Syntax, Educational Space, Spatial Analysis Theory, Visual Access and Exposure, Organizational Interaction1. Introduction
When it comes to classroom settings, the Korean government is constantly looking to facilitate learning by developing environments that support and encourage students. According to a class activity proposed by the Office of Education in 2011, the Ministry of Education in Korea also recognized the need for education to be more collaborative, and thus introduced a recommended classroom layout for an interactive space. Indeed, there are claims that future learners must have an environment that fosters diversity and collaboration, as previous research on group collaboration indicates that “the performance of each individual group member is an important contributor to success” (Wang, 2015). Therefore, each individual requires a physical setting that draws out his or her best performance in classroom activity, which ultimately results in positive academic achievement.
Space design affects the performance of both the instructor and learner in a classroom. Barriers, doors, windows, desks, chairs, writing boards and communication tools all factor into the design of a classroom space. Each of these design elements influences the physical and psychological environment of the space. In this way, space becomes a machine of social control, as its design affects human behavior and relationships. Indeed, Michel Foucault’s “Theory on Panopticism” (1975) explores the existence of power and discipline in space, and similar arguments can be found in The “Power of Place and Space” (1993) by Robert D. Sack and “Space: The Fundamental Stuff of Human Geography” (2003) by Nigel Thrift.
Foucault argues that human behavior can differentiate due to one’s physical surroundings. Depending on an imbalance in levels of visual accessibility and exposibility in space, one becomes a controller while the other becomes disciplined. Conversely, designed space with evenly distributed VA (Visual Access) and VE (Visual Exposure) levels can better enable people to interact, self-express and share ideas to build knowledge with others. Thus, it is critical to consider spatial factors on human visibility when designing educational spaces for interactive classroom activities. Additionally, “Visual Access and Exposure” (1984) by John Charles Archae explains that social relationships are stimulated (cued) by continuous interaction, and that each person’s behavior constantly adjusts to the surrounding environment. He argues a physical “setting can be conceptualized as a complex network of information channels.”
As new classroom environments emerge, so do various design proposals for barriers and seating layouts. These background research projects shed light onto why this study is necessary: to create a basis for the relationship of interaction performance, both with space barriers and seating layouts, in order to change the physical space. The research results using the VAE (Visual Access and Exposure) model give evidence on relationships that validate the need to make physical changes.
2. Method
The purpose of this study is to examine the effect of barriers and seating arrangements on interaction performance through the VAE (Visual Access and Exposure) model. The VAE is a commonly used VGA model that identifies social relations, especially hierarchy patterns, within a space. It accurately explains how spatial characteristics can create patterned behavior among group(s) of people.
There are three steps to VAE analysis. First, classroom design samples, 64 total, are selected to run through a VAE test. Second, the VAE test (using the SaVAE application) examines how space users are visually accessed (VA) and exposed (VE) in space. Third, VA and VE data for each classroom are analyzed using the Coefficient of Variation (CV) to verify which design variants contribute to an evenly distributed VA and VE level for each occupant in the space. The level of Coefficient of Variation (CV) is then ranked for each seating layout to identify comfortable interactive environment settings.
2. 1. Classroom Samples
Test running classroom samples vary by space configuration and design elements. A total of 64 sample types – a combination of 1) 16 variation types of barrier configuration, and 2) 4 variation types of seating arrangement – are run through the VAE model. All VA and VE totals are then collected and analyzed.

Design Sample Variations 1 ~ 64
Selected classroom units follow the Standard Building Code, both for Middle and High School, from the School Facility Standards Guidelines provided by the Korean government.

Dimensions of sample classroom, desk and chair
The seating arrangement follows the Standard Building Code, both for Middle and High School, from the School Facility Standards Guidelines provided by the Korean government. There are 24 seats total for each type.

Seating Layout Types in classroom
There are a total of 16 types of barrier layout samples, which are configured with two types of variants: 1) 4 types of fixed barrier designs, and 2) 4 types of movable barrier designs. For fixed barriers, four different types of openness level – ~20%, ~100%, ~50%, ~60% – are covered. See figure 4-7 for elevation examples. Conversely, movable barriers vary by layouts inside the classroom.

0% opening elevation example for barrier type 1-4, with. Top: Rendered Elevation, Bottom:Openess Variation (Black:Barrier, Red:Openess)

100% opening elevation examples for barrier type 5~8

~50% opening\ elevation examples for fixed barrier type 9-12

~50% opening elevation examples for fixed barrier type 13-16,
As shown in Figure 8, the permanent wall (black) is 2500mm in height. The fixed barrier (blue) is 2500mm height. The dashed blue lines indicate barriers with 1200mm height. The magenta lines indicate movable barriers, also known as partition(s), in 1800mm height. The design of fixed and movable barriers may vary for each classroom sample. All barriers are set to global standard heights.

Barrier Types, ISO view
2. 2. VAE (Visual Access and exposure)
VAE is a type of space syntax, model and theory articulated by John Charles Archae (1984), which quantitatively analyzes spatial influence in a social relationship through human visibility. VAE is one of the Visual Synthesis models used to quantitatively measure how much occupants can see (visual access) and be seen (visual exposure) from various positions inside a space.
Occupants with a high level of VA will have fluent flow of surrounding information. Occupants with a low level of VA will have poor flow of surrounding information. Occupants with a high level of VE will be highly visible. Occupants with a low level of VE will have poor physical visibility. An occupant’s behavior is affected depending on his or her level of VA and VE. When VE is much higher than VA, higher restrictions are brought to the behavior. When VA is much higher than VE, higher control and possibilities are brought to the behavior. Thus, the design and position of the space can define how much control occupants have. The design includes orientation, position of occupants, barriers, windows and furniture.
Previous studies demonstrate that a person
 positioned in the middle of the room has a low VA level, where the edge of the room
 has a high VA level. Occupants prefer to position in the edge of the room where they can access high visibility and information. High levels of VE means that one’s behavior is being monitored by the surroundings. (Figure 9)

Example of VA and VE Results
Previous classroom spaces followed a top-down educational model, giving instructors the highest VA level and students the highest VE level. Current classroom preferences are different. All occupants, instructor and students, in a classroom prefer to have equal levels of visibility and information access to one another. Therefore, equal levels of VA and VE for each occupant is recommended.
2. 3. VAE Analsis Process
The floor plan samples (with barriers) are drawn in AutoCAD, and the VAE calculation was run using the SaVAE application. The VAE was run at a sitting eye level of 1060 mm. Considering both sex and the age range of middle and high school students, ages 14 to 19, the mean value was 1060mm. After the VAE calculation is run, a seating layout is placed on the center of the floor plan (Figure 10). The same process will be done for Layouts A, B, C and D.

Vantage point ID on the floor plan, Barrier Type 1, Layout C
After placing the layout, the researcher located the vantage point ID of each seat and collected their VA and VE levels. Figure 11 shows an example of how it will display when the ID layer and Layout C layer are placed over the floor plan of Barrier Type 1. Figure 12 shows an example of VA and VE values on the VAE Excel chart. For layout type A, barrier type 1, seat number 6: the ID is 121C9, the VA level is 103122, and the VE level is 83918.

Vantage point ID 121C9 on seat #6-Layout C-Barrier Type 1

VA and VE values for ID 121C9
The researcher collects the VA and VE data for each vantage point ID for all 24 seats. This process is done for all of Layout A, B, C and D placed in all 16 barrier types. In total, 64 sets of group data will be collected.
The sets of group data are then analyzed to find the CV (Coefficient of Variation). In order to get this number, sets of group data will need values for their mean, standard deviation (SV), and relative standard deviation (RSD). The CV is the percentage (%) of RSD. Again, the CV and RSD are more convenient to use when comparing data sets with different means or units. The RSD is the standard deviation (SV) divided by the mean. Figure 13 shows the result example. All data were collected and analyzed to make comparisons.

Example of Mean, SV, RSD and CV for set of group data of VA
3. Result
3. 1. Coefficient of Variation Comparison
The Coefficient of Variation (CV) is used to measure the spread of VA and VE levels in the space. The barrier variables – 0% opened (fixed), 20% opened, 50% opened, and 60% opened –- influenced the CV values. Moreover, moveable barrier influence was considered, as different barriers willl create different environments to support interaction.
The CV values of VA and VE had a larger difference depending on barrier design. The lowest CV value was made in a classroom design with less openness (more barriers) between the classroom and the corridor, and more openness (fewer barriers) within the classroom space.

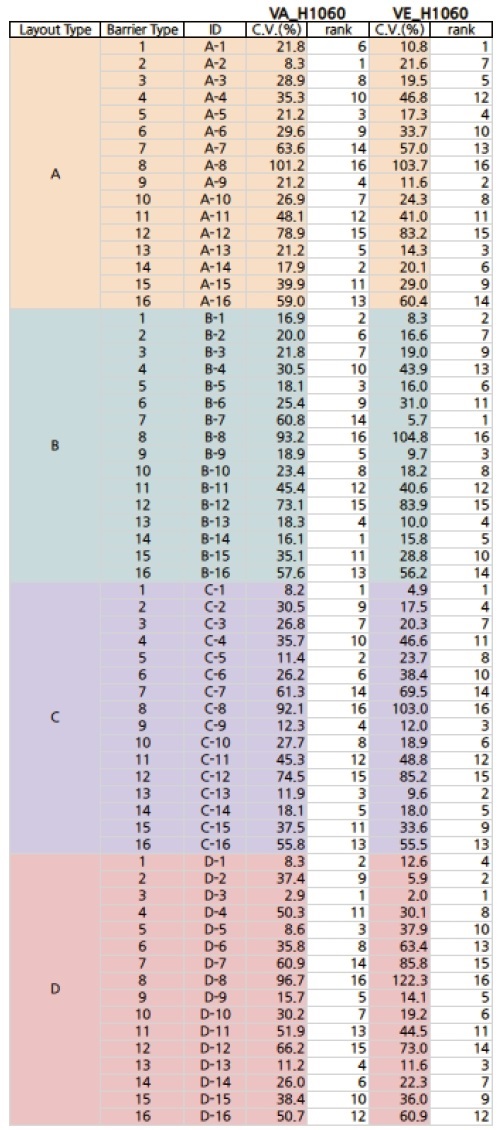
Data chart of VA and VE analysis result, with CV Ranks
The lowest value of Coefficient of Variation is design sample C-1 and ranks afterwards are as follows: D-1, C-13 and D-13.

Classroom Design Samples of C-1(top left), D-1(top right), C-13(bottom left) and D-13(bottom right)
From the data chart above, the highest value of CV is from classroom design sample D-8 and ranks afterwards are followed by A-8, B-8 and C-8.

Classroom Design Samples of C-8(top left), D-8(top right), C-8(bottom left) and D-8(bottom right)
3. 2. Seating Layout Comparison
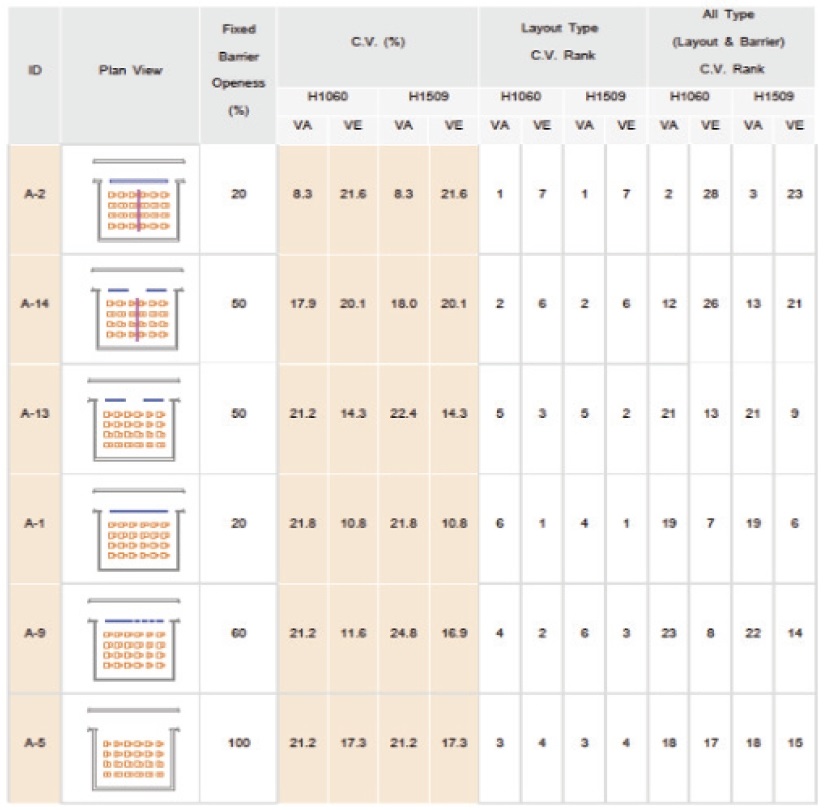
The research results indicate that a classroom half the normal size is more suitable for lecturing. The space offers near equivalent visual access and exposure levels to all students participating in class. Excluding these facts, lecture classrooms are recommended to have no barriers inside. A-1, A-9, A-5, and A-13 are ranked after A-2 and A-14 in CV rankings for layout type A.
Data chart of Suitable Space Design for Layout Type A
For layout type B, it is recommended to have fewer openings to the corridor and no partitions inside the classroom. Comparisons are shown in Table 3 below. The below layouts are the most suitable space design options, which have the most equivalent visual access and exposure levels for the whole class.
Data chart of Suitable Space Design for Layout Type B
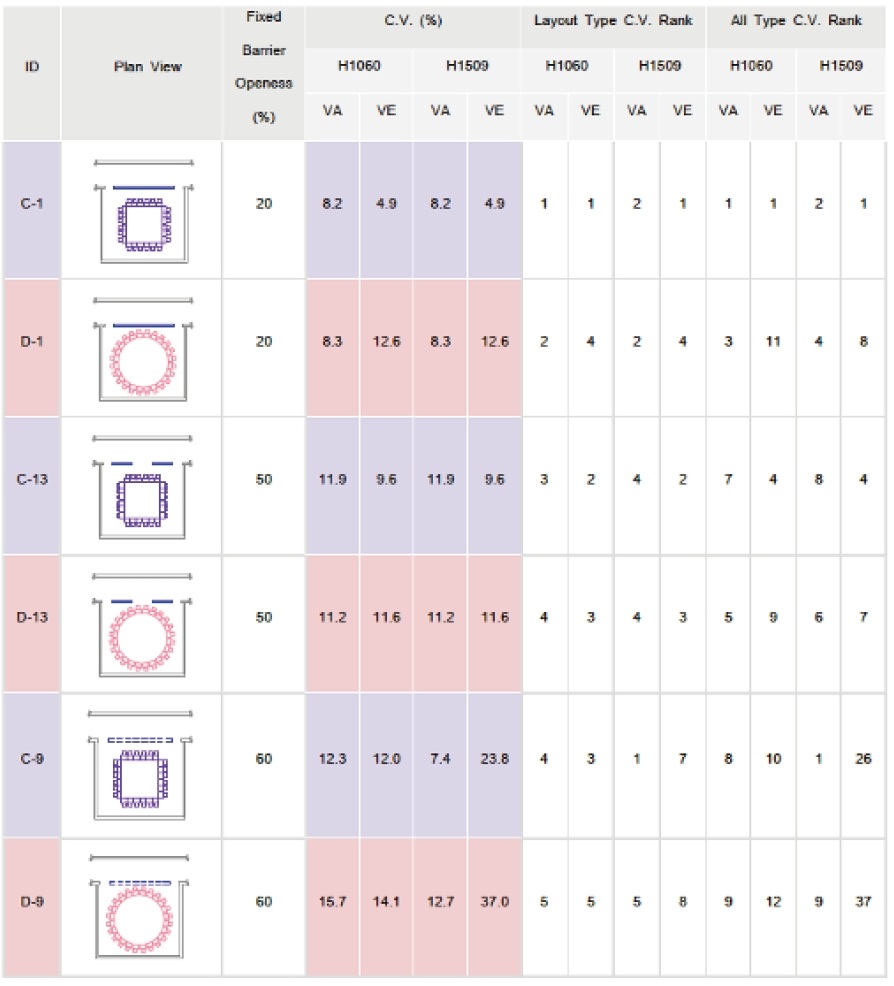
For layout type C and D, it is recommended to have fewer openings to the corridor and no partitions inside the classroom. The space design figures in table 4 are the most suitable configuration for layout type C and D. It has the lowest CV value for both VA levels and VE levels, creating the best environment for all students to evenly participate in the same activity.
Moreover, square-hallow seating arrangements can be more suitable than circle-hallows for interactive activities. Overall, square-hallow seating arrangments resulted in lower CV values than the circle-hallow.
Data chart of Suitable Space Design for Layout Type C and D
3. 3. Overall Layout Comparison
From the VAE test results, the hallow shape seating arrangement is assumed to create the best performance in classroom interaction. However, it is recommended to design seating arrangements and barriers by activity types.
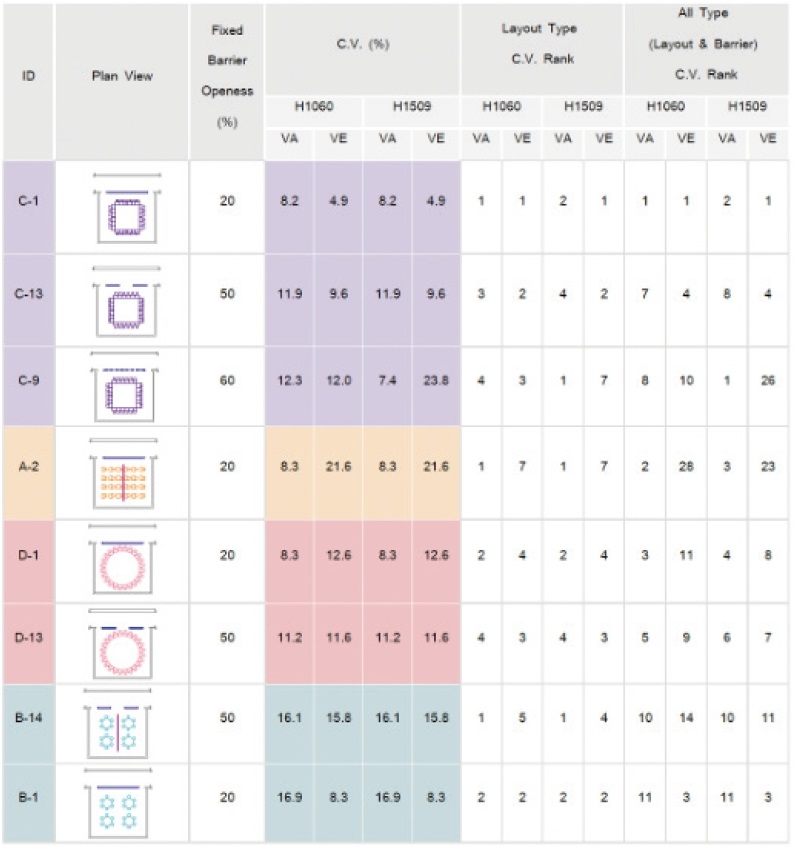
All the layouts listed in Table 5 are the top ranked from each type of seating arrangement. Also, their CV for VA and VE levels are in the top 30% of all types (layout & barrier) of CV ranking. Thus, these are the most suitable layouts for classroom interaction. Consider these layouts when designing a classroom space. For layout type A: only A-2. For layout type B: B-14 and B-1. For layout type C: C-1, C-13, C-9. For layout type D: D-1 and D-13. The majority of the top ranked arrangements use a hallow-shape seating arrangement.
Top C.V. ranks for each seating arrangement types
4. Conclusion
This paper explores the spatial characteristics of classroom design and determines the features that support educational interaction. The researcher designed 64 sample classrooms and used the VAE (Visual Access and Exposure) model to examine the correlation between space characteristics and human behavior. A space with evenly distributed VA (Visual Access) and VE (Visual Exposure) levels facilitates greater interaction among participants. Lastly, barrier design influences the VA and VE levels.
Although there are limitations in applying this theory model to all classrooms, the research results may be beneficial for design practitioners considering interactive and collaborative workspaces, providing insight on spatial influence on social relationships through human visibility.
Acknowledgments
This paper was written based on the Master’s Thesis of Seoul National University in 2017.
Notes
Copyright : This is an Open Access article distributed under the terms of the Creative Commons Attribution Non-Commercial License (http://creativecommons.org/licenses/by-nc/3.0/), which permits unrestricted educational and non-commercial use, provided the original work is properly cited.
References
- Archea, J. (1984). Visual Access and Exposure: An Architectural Basis for Interpersonal Behavior. Pennsylvania State University.
- Bae, S. (2015). Influence of Spatial Layout on Physical Activity and Face-to-Face Interactions in the Work Environment. M.S., University of Minnesota.
- Cho, J. (2011). 학교시설기준 개정에 관한 연구 (정책연구과제 2011-공모-19) [A Study on the Revision of School Facilities Standards]. Korea Educational Development Institute.
- Cho, Y. (2009). (a) Study on the Development of Spatial Analysis Model Based on Human Visual Perception (인간 시지각에 기초한 공간분석모델 개발에 관한 연구). Seoul National University.
- Chung, S. Y., Cho, S. B., & Seok, J. J. (2009). Creative Human Capital Development Strategy of Korean Government-sponsored Research Institutes: From the Perspectives of the Life Cycle Management of Human Capital. Journal of Technology Innovation, 17(2), 187-206.
- Cillia, H., & Luchetti,, R. (2004, June 15). Collaborative Work Environments: A New Team Based Approach. In NeoCon 2004, CWE.
- Duffy, F. (2008). Work and the city. London: Black Dog.
- Dursun, P. (2007, June). Space syntax in architectural design. In 6th international space syntax symposium (pp. 01-56).
- Effective Classroom Seating Arrangements. (2016, August 25). http://www.displays2go.com/Article/Effective-Classroom-Seating-Arrangements-32.
- Foucault, M. (1995). Discipline and Punish: The Birth of the Prison, 3. Panopticism. Vintage Book.
-
Harrison, A., & Hutton, L. (2013). Design for the changing educational landscape: Space, place and the future of learning. Routledge.
[https://doi.org/10.4324/9780203762653]

- Herman Miller Inc. (2008). Rethinking the Classroom: Spaces Designed for Active and Engaged Learning and Teaching. Education, Engagement, Research Summary, Solution Essays. http://www.hermanmiller.com/research/solutionessays/rethinking-the-classroom.html.
- Herman Miller Inc. (2009). Adaptable Spaces and Their Impact on Learning. Education, Collaboration, Research Summary, Solution Essays.
- Hill, L. (2006). How to Manage for Collective Creativity. TEDxCambridge.
- Sime, J. D. (1998). Visual access configurations: spatial analysis and occupant response inputs to architectural design and fire engineering. In Proceedings of the 15th International Association for People-Environment Studies Conference (pp. 140-151).
- Kim, E., & Byun, S. (2015). Study on Anthropological, Moral Educational Meaning of Classroom Space. Journal of Ethics Education Studies, (36), 153-169.
- Kim, Y. (2012). 교육적 공간으로서 교실에 대한 고찰 [A Study on Classroom as Educational Space]. Elementary Education Research, 19(2), 59-79.
-
Olson, G. M., & Olson, J. S. (2000). Distance matters. Human-computer interaction, 15(2-3), 139-178.
[https://doi.org/10.1207/S15327051HCI1523_4]
- Robinson K. (2006, February). Do Schools Kill Creativity? [Video]. https://www.ted.com/talks/sir_ken_robinson_do_schools_kill_creativity?utm_campaign=tedspread&utm_medium=referral&utm_source=tedcomshare.
- Sime, J. D. (1998). Visual access configurations: spatial analysis and occupant response inputs to architectural design and fire engineering. In Proceedings of the 15th International Association for People-Environment Studies Conference (pp. 140-151).
- Smith, S. C., & Scott, J. J. (1990). The collaborative school: a work environment for effective instruction. Publication Sales, ERIC Clearinghouse on Educational Management, University of Oregon.
- Song, A. (2011). 헤르만 헤르츠버거의 사회적 소통을 위한 교육공간특성 연구 [Hermann Herzberger's Study on Educational Space Characteristics for Social Communication]. Journal of the Korean Institute of Interior Design, 20(6), 300-310.
-
Wang, X., Schneider, C., & Valacich, J. S. (2015). Enhancing creativity in group collaboration: How performance targets and feedback shape perceptions and idea generation performance. Computers in Human Behavior, 42, 187-195.
[https://doi.org/10.1016/j.chb.2014.02.017]
- Kim, Y., Yoon, J., Kim, M., Shin, H., Noe, S., & Choo, Y. (2006). 창의적인 인재 양성과 효율적 교육체제의 구축 [Cultivating Creative Talents and Building an Effective Education System]. Policy Forum for Korean Educational Development Institute.
- Yoon, Y. (2006). 고등학생의 학교풍토 지각에 따른 창의성과 대인관계 연구 [a Study on Creativity and Interpersonal Relationship According to Students' Perception of School Climate in High Schools]. Educational Development Research, 22(2), 23-44.