A Study on the Diagnostic Method of Lineup Flow and Core Design Area to Secure Design Identity
Background This study explores a strategic diagonal way to secure design identity from a homogeneity and continuity context. Therefore, the forehead part of a high-speed train was selected as the subject of this homogeneity experiment shape and longer life span. In addition, we analyzed the trend of lineup models from the initially-released prototype to more recent models. The outcomes are illustrated in a diagram as a 3-dimensional structure that is capable of diagnosing the design identity.
Methods We organized the discussion on design identity and developed a research model in consideration of homogeneity and continuity based on existing studies. Specifically, we surveyed researchers in the design sector and examined quantitative data extraction. We also applied a homogeneity analysis, through multi-dimensional scaling. In addition, we investigated the point of product release time, applied a 2-dimensional positioning map, and examined a final lineup flow and routes.
Results We analyzed and schematized the homogeneity analysis and lineup model flow to show the design identity diagonal process. First, based on the homogeneity analysis, we schematized the core design area. Second, we found that by centering on the initially-released prototype, with time, the lineup flow formed in a spiral shape. We estimated that such a flow signals and that the released models changed continuously in a gradual manner while they maintained homogeneity on the initial model.
Conclusion The discussion above is organized by identifying the core design areas in the homogeneity aspect. The 3-dimensional flow in the continuity aspect also can serve as a strategic foundation to diagnose the company’s lineup flow and deviation models. In addition, the findings are highly applicable as a strategic diagonal method to secure design identity of high-speed trains and other products. Furthermore, the findings can be utilized as a professional approach for design identity and lineup diagnosis in relation to other competing companies.
Keywords:
Design identity, Homogeneity, Lineup, high-speed train1. Research background and Purpose
Recently, design identify has been used as a key element assessing brand value and a strategic element determining design competitiveness. For instance, Hyundai/Kia Motors, to secure competitive edge in the rapidly changing global market, has realized its own design identity strategies in a more specific manner. The company applied its homogeneous unique character line and family look to the whole line-up model-specific fleets. Such lineup models [1] form a very unique and homogeneous portfolio, further developing a firm’s integrated design identity. Since 2007, Kia Motors has continuously released ‘Schreyer Grille’ lineup models to establish the whole fleet design identity. In step with this, Hyundai Motors also used ‘fluidic sculpture’ as its strategic design element to complete its lineup stressing hexagonal grille and oval stream lines.
As such motor design cases illustrate, design of airplanes, high-speed trains, vessels, and others having a live span of at least 10years, is required to secure design identity to maintain its uniqueness for a longer term.
In this recognition, this study examined high-speed trains among the products with long-term project. It is because high-speed trains are highly valuable as a future ground transport mode and have broader influence in national image enhancement as well as cultural, industrial and environmental development. [2] The transportation mode also has long been recognized by users and is subject to the development of stereotype on its form. For these reasons, high-speed trains were viewed appropriate for this study research to diagnose homogeneity development and lineup design flow.
As for advanced states, high-speed trains, since their initial prototypes, have continuously secured their lineup model homogeneity [3], boasting of their forehead part design innovations living up to technological advancement. For example, Japan, to secure the design identity [4] of its high-speed train, Shinkansen, has developed a creative and unique prototype model for its forehead as well as diverse lineup models for each route. In addition, the French TGV has continued the uniqueness of its prototype [5] while adding more aspects on local characteristics to maintain its design competitiveness. In this aspect, this study seeks to analyze the forehead design images of Shinkansen and TGV of advanced countries and diagnose their core design areas and lineup flow in terms of homogeneity in order to lay a framework for design identity establishment methodology.
2. Literature study
Among the design identity studies in South Korea, the Study on the Conformity between Brand Images and Product Identity’ (Soyeon Lee, 2004) presented a process of finding a model with the closest image to the corresponding brand by identifying and applying the main brand sentiment to new product appearances. The Study on Assessment Model for the Identity of Brand Image and Design Image (Yeongmi Goh, 2005) stated that both the design image and brand image should conform to each other and concluded that the core design areas should be tuned to brand image [6].
Such preceding studies have in common to mention the appropriateness and necessity of securing design identity based on sensibility assessment. They evaluated the intangible image of brand and tangible image of design to be in the same dimension and applied the 2-dimensional positioning map. However, the elements coded on the plane 2D positioning map are mostly adjectives from sensibility assessment or brand images. In this recognition, it was deemed necessary to perform a diagonal process first by using practical product forms or images in order to identify the dispersion extent and locations of the already released models as a whole. In addition, to clearly understand the lineup flow of the models available on the market, the idea of their release period-specific time difference deemed to apply as well.
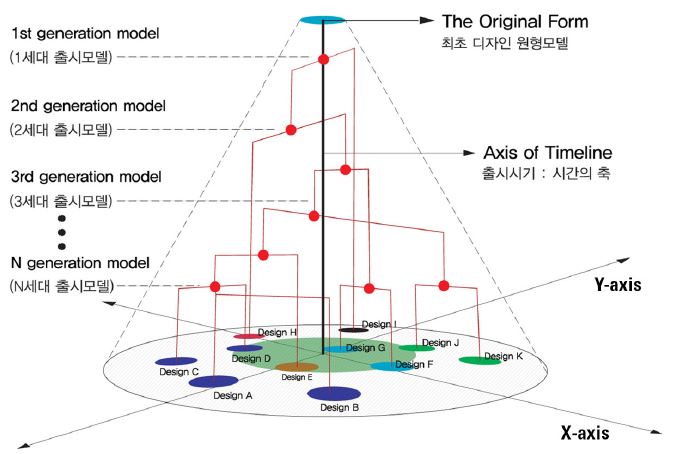
Therefore, the axis of timeline (Z axis) was introduced to the extant plane positioning map to build a 3D model realizing more effective diagnose of lineup model flow in space.
3. Research model
Figure 1 shows the 3D structure research model built by adding the axis of timeline to the flat 2D positioning map to show the relationship between the original design forms with lineup models. The research model was estimated based on the hypothesis as follows :
- H1: The design image homogeneity analysis could show the core design identity areas on the 2D positioning map.
- H2: The analysis of lineup model flow according to their periods of release could identify 3D lineup structures.
Based on the hypotheses, the homogeneity analysis was performed for the sample of high-speed train forehead design images to find out the location of 2D positioning map (X and Y axis). And the timeline was set as the Z axis to come up with a 3D flow.
4. Research
4. 1. Data collection and research designing
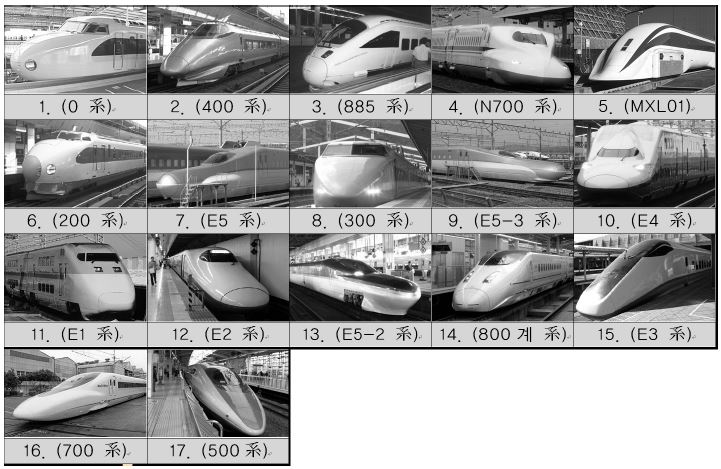
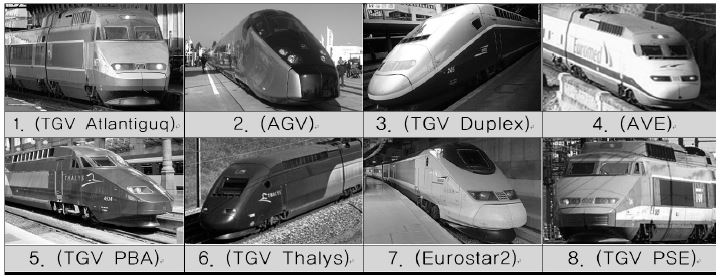
In this research, the sample of forehead images of Shinkansen and TGV was presented to 100 graduate college students from industrial (product, environment) design, architectural design and design engineering for survey. The show-card images of released models were compared one to one so that the participants could view the design form similarity and answer in a 7-point scale.
The survey was processed by SPSS statistical package under the analytical method of multi-dimensional scaling. The multi-dimensional scaling method is to place an object in a 2D space based on the similarity (homogeneity) scale [7] among the targeted objects. Those without similarity are positioned far away from each other while those with stronger similarity, closer to each other. As for the multi-dimensional scaling, one-to-one comparison is used to mark in a 7-point scale. For this reason, if there are lots of images in a sample, survey respondents may be mentally stressed while losing concentration. For instance, there are 17 Shinkansen image in Figure 3 but to gain enough survey data for statistical process, 136 survey question items are necessary in total. Specifically, if we compare image #1 with 2, 3, 4, 5, 6, 7, 8, 9, 10, 11, 12, 13, 14, 15, 16 and 17, we will get 16 question items; compare image #2 with the others, we’ll get 15 items; compare image #3, 14 items and so on. In this way, one single respondent will have 136 question items in the survey.
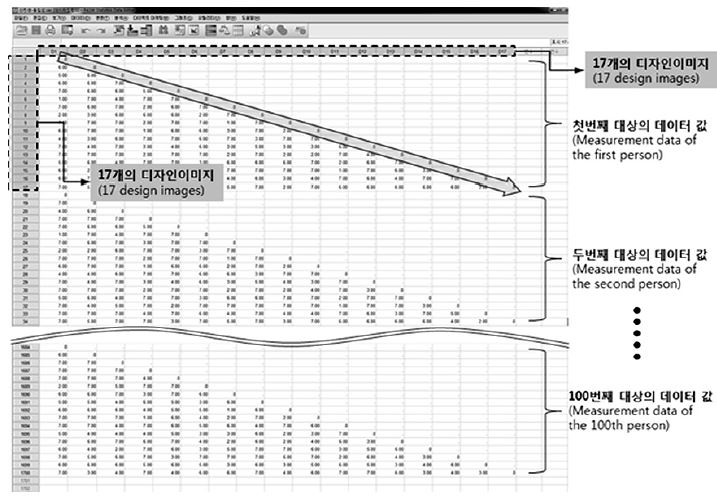
Figure 2 above presents the image of entering the survey data to the SPSS statistical package. To input the survey results of 100 respondents and operate the multidimensional scaling, the total of 13,600 cells has to have data values. Therefore, the respondents were encouraged to answer the questions in a serial order. This is to prevent errors and confusion for data input in the process of post-collection data quantification. And to secure the objectivity in survey process, products were randomly selected for numbering regardless if their release orders. In other words, the show-card numbers and model lineup orders are not mutually related. And similarity assessment was done based on one-to-one comparison.
In this research, a 7-point Likert scale was structured for homogeneity analysis utilizing the multidimensional scaling. On the scale, similarity spans from 1 point (very similar) to 7 points (very different). For instance, when comparing two images, the more homogeneous they are, the closer they are to 1. And images seem to have almost no similarity are closer to 7 as instructed to the participants. Figure 2 above shows that the areas of diagonal arrow are all 0. This means that when comparing the same images, they have the same similarity only to make 0 distance naturally.
Regarding this, the author(s) of the study visited familiar places of respondents or their research labs to provide full explanation on the survey purpose and method before answering.
5. Results and Discussion
5. 1. Results of multidimensional scaling on Shinkansen design images
Table 3 is the results of multidimensional scaling analysis, the repeated convergence of the 17 images according to their homogeneity extents as assessed by the 100 respondents in total. As a means to stop the repetition if the final stress value is less than 0.005, 0.00001 was keyed in above so that the process was repeated 5 times to meet the S-Stress convergence criteria. Consequentially, the final stress value was found to be 0.14944 (<0.15) to show appropriateness for the estimated distance. And RSQ was 0.89145, exceling 0.6 to show fair explanatory power of the analysis result. Therefore, the results of 2D perception diagram on the released were viewed to have a good explanatory power appropriate to identify the locations on the image map and their flow.
Table 4 is the results of multidimensional scaling analysis on TGV. The current stress value is 0.14872 showing appropriateness for the estimated distance. RSQ is 0.87092, exceling 0.6 to have a good explanatory power of the analysis results. Accordingly, the actual images were substituted to the 2D perception diagrams of Shinkansen and TGV based on the multidimensional scaling to visualize the positioning map.
5. 2. Euclidean distance model according to multidimensional scaling results
(1) Results of Shinkansen design-image distance measurement
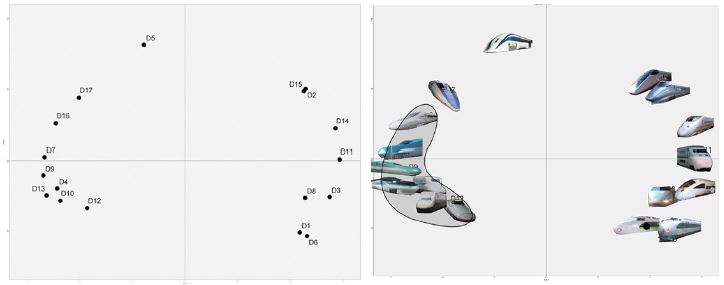
Figure 5 is the results of placing on the perception diagram the 2D map results of Shinkansen forehead images. In both sides of the vertical Y axis, there are two groups with stronger homogeneity on the 2D plane. The group on the right includes models released before 1997 and it shows shorter and rounded forehead shapes. In contrast, the group on the left has a closer density among itself than the right-side group and includes more recently-released models.
Therefore, it is presumed that the group on the left holds core design areas with stronger cohesiveness than the group on the right.
(2) Results of TGV design-image distance measurement
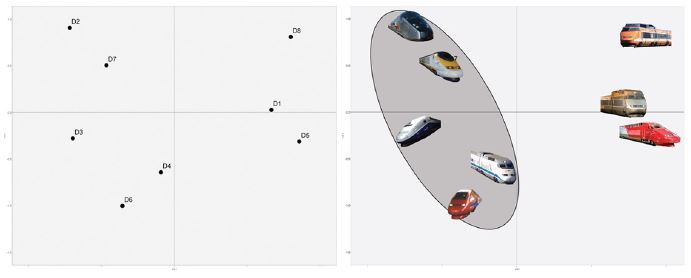
Figure 6 shows the results of placing the actual images on the 2D map results of Shinkansen forehead images. The results are divided into three large areas and the two groups on the left and right have similar distances and area sizes. The three models on the right are the initially released one and those released until the early 1990s. The three models on the upper left side are those from late 1990s to recent period. It needs to be noted that after the D4 (AVE) model release, the vertical border, the high-speed train forehead design has evolved to take a streamlined shape while developing its canopy design. Thus, the whole area on the left is presumed to be the core design area.
5. 3. Orientation according to product release timeline
Each Shinkansen and TGV model release timelines were examined and substituted to corresponding model locations on the 2D positioning map to diagnose and trace the flow of lineup models as below.
(1) Design flow and orientation of Shinkansen high-speed train
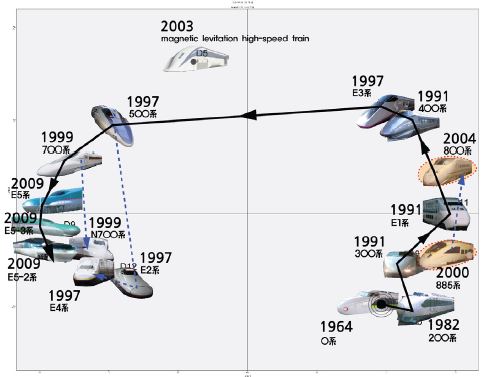
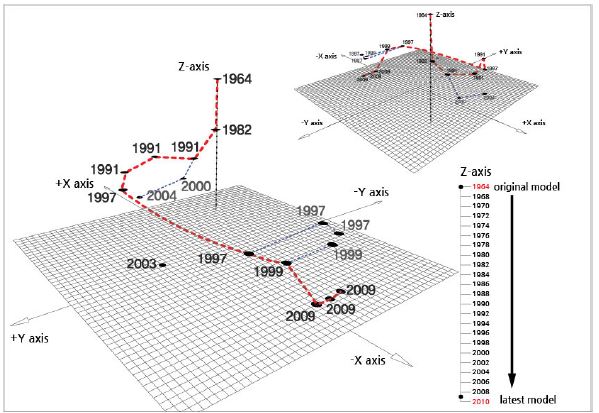
First of all, as for Shinkansen, to draw its design flow and orientation, its 17 show-card model images were marked on the map in order of their release timeline from the oldest image to most recent image to trace their movement trajectory. As a result, its design trend was identified along the release timelines as in Figure 7. From the initially-released model in 1964 to the one in 2009, the designs move from right to left on the map. Special aspects are as follows: models launched in 1997 (E2, E3, E4 and 500系) became most distanced while forming a section with huge lineup changes. The maglev train shown in 2003 is in a similar location to that of 500系 in 1997. But the maglev train was excluded from this lineup flow examination as it does not use electricity as it power source.
The general flow starts from the lower right to upper right, leading to the upper left then lower left. As for design changes, the simple streamlined shape changed to the shape with a stronger character having a longer, duckbilled nose. After 1997, 700系 and N700系 were released in 1997 and beyond, changing the duckbilled shape to a more restrained and sharper form. Leading to the 2009 E5系 models, the nose has grown even longer to reach almost up to 25m. Based on this situation, it is presumed that the X axis of the map represents the characteristics according to nose lengths (-X axis: long, +X axis: short) and the Y axis represents the degree of forehead sharpness (-Y axis: round, +Y: sharp).
(2) Design flow and orientation of TGV high-speed train
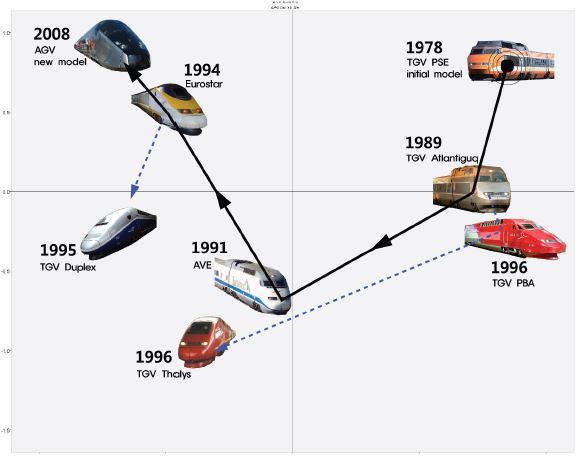
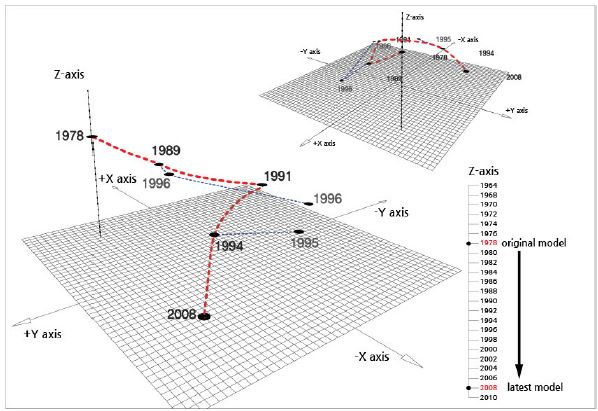
According to the trend of TGV model release timelines from 1978 to recent period, the images were substituted in the map for this research analysis. As a result of the image map observation in Figure 8, the lineup products were found to move from the upper right side, through lower right to lead to the left side. Those on the right side include the initial model launched in 1978 and show similar images until the 1989 model. They are mechanical and typical appearances of conventional train. Especially the forehead nose and canopy are angulated. With the 1991 AVE model, the shape started to change more streamlined. After the 1994 Eurostar, the lineup led to Duplex in 1995 but it moved backward to resemble the 1991 model in terms of design evolution. Duplex is deemed to be an outlier of the mainstream design flow.
In the later 1990s, the forehead angles disappeared unlike in the past. Also the AGV model in 2008 maintained the sense of volume and restricted character lines in the streamlined forehead, etc., taking the uppermost place on the left side of the map among all.
The bottom skirt of the 1995 TGV (Duplex) model and the angulated nose end of 2009 AGV model are similar to those in the 1970s to 80s. Based on this trend, it was deemed that the X axis of the TGV image map represented characteristics according to the mechanical shape of nose or streamlined shape (-X axis: streamline, +X axis: mechanical) and the Y axis represented the degree of forehead roundness and angulation (-Y axis: round, +Y axis: edge). Special noteworthy aspects are, first, the 1996 PBA model is a mechanical upgrade and has almost similar appearances to the initial model (TGV PSE). Second, the Thalys model shown in the same year as PBA model has far unlike appearances from the models before 1989, representing the absence of appearance similarity and generated no further lineup model. The 1995 Duplex also brought no subsequent lineup model. In other words, these three models broke away from the mainstream lineup design flow. Third, the distance with Eurostar in 1994 and that with AGV in 2008 are shorter than the distance with Duplex in 1995. The streamlined foreheads, bottom skirts, headlight locations and canopy forms are similar. Thus, as in Figure 8, the mainstream lineup flow and breakaway route were found.
Consequentially, based on Figures 7 and 8, the lineup flow and routes were discovered along with the designs in highly homogeneous areas. By assessing the shape features and similarities, the characteristics of the image map axis were inferred herein. However, for a more accurate understanding of the features or specialties of image map axis, more comprehensive method will be necessary to assess sensitivity and draw appropriate key words for each axis orientation or a more objective method to analyze images nearing the end of each axis for compression. Given the characteristics of spatial distances between 2D map-positioned images, it is found that Shinkansen and TGV are aiming at two different orientations. However, it is hard to compare the meaning of these two for specific explanation. In other words, if the Shinkansen and TGV models have been assessed together from the first, we could compare their locations and flows on the image map with each other. But since the models from two brands were separately asked in the survey and the positioning map was structured, their design change orientations are hardly compared to each other. Still, it is noteworthy that certain arches are found in the design trends of Shinkansen and TGV lineups. This orientation is resulted from the 2D materials. To come up with a more concrete flow, the axis of timeline was inserted as the Z axis to map them in consecutive order from the uppermost rank and downward.
5. 4. Vertical lineup diagnosis of image map combined with release timeline
(1) Research subject-specific design lineup flow
Figure 9 displays the 3D structure diagram of the 2D Shinkansen design-image map. Starting from the first original model in 1964, it smoothly links the design releases until recently to show the 3D spiral structure. It is noted from the results in Figure 9 that the overall evolution has a spiral form including not only the models on the mainstream line but also those off the line. The significance of this finding is that the models have gradually changed in a spiral trajectory centering on the very first model.
Figure 10 displays the 3D structure diagram of the 2D TGV design-image map. The 1995 model and 1996 model seem to break out from the mainstream lineup track. But they have no subsequent lineup and are not much far away from the main track to form the overall spiral orientation. That is, the TGV lineup models, compared to the Shinkansen models, despite their late release of the first model and relatively shorter history, show a 3D spiral structure with certain continued intervals.
(2) 3D structure using the vertical lineup flow according to product release timelines
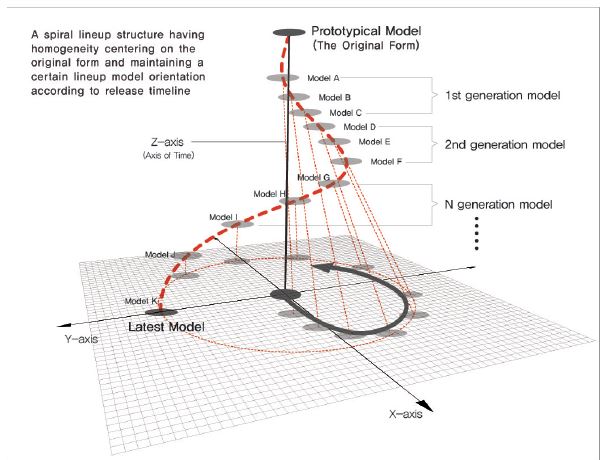
Figure 11 shows the 3D diagram presentation of the results of Figures 9 and 10. To summarize, homogeneity analysis was performed to find the identity of high-speed train forehead design and a flat spiral flow was found accordingly. The spiral flow was further presented in 3D spiral structure by applying the axis of timeline (Z axis).
Comprehensively, based on the results of Figures 9 and 10, the following conclusion is made. As for products or transportation modes with longer life spans, if they continuously release lineup models having homogeneous appearances, the lower-part width of their 2D area would be narrow as in the diagram of Figure 13 and they form a 3D spiral structure with a longer Z-axis (timeline axis). On the other hand, products with wide diversity and shorter release intervals have a shorter Z axis (timeline axis) to shape a relatively flat spiral. Thus, based on Figure 11, thes research hypotheses are verified as follows:
First, design image homogeneity analysis can diagnose core design identity areas. That is, the multidimensional-scaling image map based on homogeneity can be a way to identify outlier image designs from the scope of the original model while showing closest-distanced designs in their appearance similarity and homogeneity.
Second, using brand-specific design images, their lineup design flows and routes can be found according to their release timelines. Specifically, it can diagnose the kind of lineups keeping the unique original traits as well as those in a new territory. Such a method is expected to serve as a guide to suggest a future model design orientation while examining new rival brand design lineups.
That is, if we can find the core design area of released models as well as their lineup routes, formative approaches for future models will be effectively made. Moreover, evolution and changes in nonformative aspects such as colors and materials of new models will be better predicted.
6. Conclusion and Proposals
This research approached design identity establishment from the perspective of homogeneity and continuity and provided the diagram of practical research-model results based on the hypotheses herein. To sum, first, a company’s own released models need to be analyzed in terms of homogeneity and its core design area should be identified. This is to examine outlying design images from the core area of an image positioning map or find a figurative similarity or appearance homogeneity. Furthermore, if measures like sensitivity assessment are utilized to understand the characteristics of core design area, we can expect to have more empirical data to view design identity.
Second, a 3D lineup structure was diagnosed herein after examining the lineup model flow according to release timeline. Such a method is expected to be a framework of building a more professional design system capable of anticipating future model design orientation or suggesting lineup strategies. In other words, the method can be utilized in predicting future model lineup patterns or routes to bypass or make a change or determining and predicting the timing of new lineup separation. However this study is limited in producing more objective results by examining a smaller population of 100 people. It is expected that the persuasive power would grow with a larger sample, for instance, and more controlled question items, etc. Indeed, more empirical results can be expected from enterprise-led projects based on more diversified sample classes such as designers, customers, etc. In this sense, such a project can be used as a strategic approach to secure design identity.
Recently in South Korea, there are increasing successful design strategies for design identity solidification or effective design management. Still, some large and smaller firms have not built effective design identity strategies or have released products emphasizing solely creativity or uniqueness. Especially goods with broader socio-cultural effects need to continuously develop and evolve their design identity along with technological competitiveness. In this sense, if we can analyze design identity in terms of released model homogeneity and continuity as well as the lineup flows and outlying models among rival products, we can establish a strategic base using an objective and logical process to build design identity.
Such a method can be utilized as a professional design tool to search for the orientation of future models and lineup strategies. It will also serve as the basis for setting up more aggressive design management strategies regarding design differentiation efforts from rivaling products or niche market development. To this end, competing firms’ lineup models need to be measured at the same time to provide more case studies through which empirical comparison can be made effectively with advanced and more competitive models.
Acknowledgments
This work was supported by the research fund of Hanyang University(HY-2013-G).
Notes
This is an Open Access article distributed under the terms of the Creative Commons Attribution Non-Commercial License (http://creativecommons.org/licenses/by-nc/3.0/), which permits unrestricted educational and non-commercial use, provided the original work is properly cited.
References
- H. C, Kim., J. H, Kim., & J. T, Kim. (2006). On Design Factors to be Considered During Light Railway transit System Development. Journal of the Korean Society for Railway, 9(6), 711-716.
- M. J, Jin. (2005). A study on the Identity for Railway Culture Design & Technology. (Doctoral dissertation). Seoul National University of Science and Technology, Seoul, Republic of Korea.
- J. H, Seok. (2010). A study on the Expert System for actual approach and a strategic model of the Design Identity. (Doctoral dissertation). Hanyang University. Ansan, Republic of Korea.
- S. Y, Yang., J. H, Seok., J. W, Han., & K. J. Park. (2008). A Study on an Expert Estimation System for a design Original Form development. Proceedings of the Korean Society for Railway, (pp. 475-481). Seoul.
- J. W, Han., & J. H, Seok. (2008). A Study on a streamline nose approach method which applies a Image Implementation Technique. Proceedings of the Korean Society for Railway, (pp. 871-879). Seoul.
-
Pettijohn, L. S., Mellott, D. W., & Pettijohn, C. E. (1992). The relationship between retailer image and brand image. Psychology & Marketing, 9(4), 311-328.
[https://doi.org/10.1002/mar.4220090405]

- Kruskal, J. B., & Wish, M. (1978). Multidimensional scaling. 11. Sage.
