Prediction of the Emotion Responses to Poster Designs based on Graphical Features: A Machine learning-driven Approach
Background Advances in data science have allowed us to investigate human emotions based on the learning of the data set, with current technology enabling us to research the relationship between the form elements of graphic images and human emotional responses. However, to date, studies have been limited to photography, meaning that the practice of graphic design remains unexplored.
Methods We used a design workshop to exploit graphic elements that are perceptually relevant. By identifying and quantifying the elements of each image (N = 320), we were able to define the machine learning features. We collected emotion assessments relating to the images with regard to pleasure, arousal, and dominance using a Likert scale, and combined them with the features to build a dataset. The assessments were carried out twice to form a baseline of accuracy. Applying machine learning methods such as kknn, svmRadial, and C5.0, we modeled algorithms that predict individuals’ emotional assessments of specific aspects.
Results Human assessments were repeatedly in the range of 62.81–80.93%, and a prediction accuracy between 52.26–80.32% was achieved. In particular, the prediction accuracy of pleasure and dominance aspects was relatively high across all individuals.
Conclusions This study demonstrates the use of machine learning-driven algorithm modeling to predict assessments of emotion based on graphical elements of movie posters. Overall, predictions of pleasure and dominance aspects showed higher accuracy than those of the arousal aspect. Limitations and further investigations are discussed to obtain not only a more accurate but also a more insightful estimation.
Keywords:
Graphic Design, Machine Learning, Image Features, PAD Theory, Color, Layout, Emotion1. Introduction
1. 1. The relationship between graphic elements and human emotions
Understanding people’s emotional responses to the spatial structure has been given considerable attention in many years. Traditional theories have been utilized in the design of educational and practical fields. Gestalt theory has been used to explain the human perception of visual elements (Köhler, 1967). The use of compositions of basic graphic elements can evoke certain feelings. For instance, drastic brightness contrast arouses human attention while overall dark brightness normally implies sadness or a mysterious atmosphere. Diagonal lines usually emphasize the feeling of dynamic and tense (Lauer & Pentak, 1979).
With regard to the measure of emotion, we used the parameters defined by PAD theory which consists of pleasure, arousal, and dominance. Initially proposed by Mehrabian and Russell (1974), the theory has been applied to a diverse range of disciplines to assess the emotional states made by humans. By collecting only three assessment data on three dimensions, diverse emotions were inferred, such as happy, excited, tense, relaxed, sad, violent, loved, and so on.
In the last few decades, researchers have examined in more detail the influence of visual factors. Palmer and Guidi (2011) carried out empirical experiments to find a goodness-of-fit of object locations in a rectangular frame, while Wang, Duff, and Clayton (2018) found the level of complexity was determined through various factors, such as the number of objects in use or the dissimilarity between objects. By utilizing the insights extracted from previous studies, design education instructs us on how to manipulate the basic graphical form elements to emphasize certain emotions.
In the domain of advertising, investigating the relationship between graphical elements and human emotions has received particular attention. For example, Ares et al. (2016) examined the influence of snack food label design on children’s perception utilizing conjoint analysis. During the study, cartoons and nutritional information positively affected children’s preferences of yogurt and sponge cake. In the study of Kim, Kim, and Suk (2019), poster designs were generated by articulating four graphical attributes, such as background, human objects, text and color. Conjoint analysis was used to identify the effect size of each attribute on people’s preferences.
Previous studies employed quantitative methods such as the multiple regression analysis(Han & Jung, 2019), or conjoint analysis(Hong, Lee, Yan, & Suk, 2019) to analyze the compound effect of multiple numbers of causes. However, studies commonly point out the limitations encountered when using a small number of attributes. The compound effect becomes complex, and it is difficult to determine in which area the effect is caused. In design practice, an even larger number of elements are included, leading to creative and novel design outcomes being achieved.
1. 2. Previous AI studies to investigate human emotions
Recently, artificial intelligence (AI) technologies have supported the prediction of human emotions induced by images by analyzing large-scale data. These computational methods enable us to compute complex combinations of various types of visual elements, which cannot be easily achieved through inferential statistics. For instance, systems attempt to predict users’ preferred images (Kuzovkin et al., 2018; Ma et al., 2019; Ren, Shen, Lin, Mech, & Foran, 2017) or to estimate feelings induced while users are viewing images (Corchs, Fersini, & Gasparini, 2019; Zhao, Yao, Gao, Ding, & Chua, 2016; Zhao, Zhao, Ding, & Keutzer, 2018). Actively implemented using computer science, the machine learning-driven algorithms used to understand images have mainly focused on photographic images. For example, a number of studies have used shape-related features to determine the magnitude of similarity among images (Hamroun, Lajmi, Nicolas, & Amous, 2019; Majumdar, Chatterji, & Kar, 2020; Nazir, Ashraf, Hamdani, & Ali, 2018). These attempts have been driven by engineers, and they tend to rely on traditional theories and principles to construct visual parameters when characterizing the images. Dora, Agrawal, Panda, and Abraham (2017) explored a method to effectively recognize human faces by optimizing the Gabor filter (Daugman, 1980, 1985), which is a representative texture feature. Soundes, Larbi, and Samir (2019) proposed an improved Zernike moment (1934) to detect textures in low-quality lecture videos.
1. 3. Aims of this study
As we reviewed in the previous chapter, the emotional effects evoked by a combination of graphical elements have not been investigated due to the limitation of traditional statistics, in the design research field. On the contrary, in the computer science area, prediction results have been importantly considered rather than identifying the cause and effects between elements and emotions. This is because the machine learning or deep learning methods are difficult for humans to understand its process. In particular, the feature engineering process is being relied on the computer’s decision more and more to increase the model accuracy performances. Regarding the method of studies, photographic images have been normally utilized as training sources. Also, the researchers have been focused on predicting averaged emotions. However, the emotions have subjective aspects, thus predicting individual emotions could be more appropriate.
In this research, we have attempted to investigate individual human emotions based on simple meaningful features that were derived from the design workshop. We employed movie posters as the images because they contain not only photographic content but also text and layout elements. The machine learning method was adopted to predict the individual emotional assessments of users to the poster images by considering a variety combination of graphical elements. Ultimately, we expect to show the possibility of building a computational method to analyze the graphic images. Based on the presented model development method, the systems which can present a practical design guideline of an individual graphic image can be developed. It can be applied in a practical field such as advertising and education.
2. Design Workshop
2. 1. Method of Design Workshop
Eleven designers joined the design workshop, their professional experience ranging between five and ten years; their average age was 27.82 years (SD = 1.78). The workshop was approved by the institutional ethical board (KH2020-014).
Three to five designers participated in as one group. The designers were individually given movie poster cards and requested to individually classify them into formative characteristics to explain certain emotions. For the visual stimuli, we obtained a list of 300 movies of diverse genres from Metacritic.com, a website known for its movie critiques. The 300 movies ranked within the top 300 out of more than 130,000. We printed the movie posters on A7-size cards and asked participants to cluster the posters according to their visual characteristics. After clustering the cards, designers verbally shared how they classified the cards. The total time of the workshop took approximately 90 minutes.
To analyze the data visually and linguistically at a detailed level, we transcribed all dialogues and matched them to clusters as annotations.
During the analysis process, three design researchers participated. The researchers clustered the results by utilizing an affinity diagram method (Beyer & Holtzblatt, 1999), and extracted graphic attributes that are mainly mentioned or implied during the workshop. The workshop and the analysis process are illustrated in Figure 1.

The designers were clustering the movie posters in the workshop (left). The transcribed results and classified posters’ photos were clustered in the analysis process (right)
2. 2. Result and Implication
Based on the interviews, we identified three categories of graphical elements: color, layout, and others, as shown in Table 1.

The summarized graphical elements which were meaningfully considered in the workshop
The majority of participants classified the posters according to their color, with reference to the three primary color properties: hue, brightness, and chroma. For example, some arrayed the posters along the "warm-cool" axis, saying that the warm-toned posters were associated with heart-warming stories. "Vivid-pale" and "dark-bight" axes were also taken into consideration, which corresponded to saturation and brightness, respectively. The posters which mainly used black or dark backgrounds were explained with negative emotions. For instance, D2 said, “Dark background describes a gloomy atmosphere.” D5 mentioned, “The poster containing a variety of vivid colors evokes funny and pleasant emotions.”
The dominant color and accent color can be an important attribute to classify posters, as shown in Figure 2. In addition, the accent color is related to contrast. When designers mentioned color contrast, the compared objects were mostly between background and major objects or between background and title. D3 said, “The eye-catching colored texts against black background imply a mysterious, scary, and tense story,” while D9 said, “it evokes a serious and solemn story.”

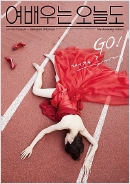
The posters clustered by the overall brightness (top). The posters used red color as either dominant color or accent colors (bottom)
Along with color, the layout characteristics were found to constitute primary formative elements. For instance, contrasts in size were often mentioned, referring to the way in which large objects occupied the poster. In general, people, the title, or other text areas were pointed out. As presented in Figure 3, they tended to cluster posters when they featured similarly proportioned humans. D10 said the background-dominant poster with a small human proportion gives an isolated feeling. D4 and D7 responded, "One-person dominated poster is likely to talk about one person's feelings or the narrative." However, the implied emotions of one-person dominated posters varied depending on the combination of graphical attributes.

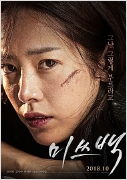
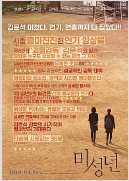
Posters clustered by the ratio of the human area to the total poster size. Background dominant posters with small human(s) (left); Face dominant posters (right)
Additionally, they grouped posters according to the location and alignment of major objects. The participants were all experienced designers and explicitly addressed issues relating to grids or alignment as anticipated. D1 and D6 explained about rhythmic and dynamic feelings based on the element positioning.
Additionally, while we accounted for the human presence, we had not yet addressed the details, such as poses, gaze, or facial expressions. As with the semantic contents of the textual information, the human contents represent more than their size and location within the poster. Moreover, the graphic style made a difference. The styles were photography based, cartoon-like illustration, or realistic drawing. However, any related font characteristics were mentioned comparatively infrequently. Instead, the location and size of texts were regarded as more important than the font type itself.
2. 3. Reflections
In the workshop, designers tended to infer the story of the movie based on analyzing image characteristics. Interestingly, certain emotions were repeatedly observed in a group of movie posters that contain similar graphical elements. For instance, the warm-tone posters generally reminded designers heart-warming stories, as previously mentioned. It implies that computational analysis based on features composed with a basic set of graphical elements may enable designers to predict users' emotions.
Also, the computational method can enhance communication between designers. Although participating designers had similar background knowledge, communication was often difficult due to their different perceptive attributes. This is because the words used to describe the characteristics of graphics meant something different for each person. For instance, D7 said, "The title is written in bold font." However, the perceptive quality of boldness differed among designers. For instance, the actual “bold” font can be seen as “medium” to someone.
Overall, the graphic design interpretation process is aligned with the Gestalt theory that people perceive visuals in the simplest way (Köhler, 1967). For example, designers did not consider every detail of posters to respond to the implied emotions of the given posters. The combinations of perceptually meaningful elements affected by their judgment.
Thus, systemizing basic design features such as theme colors, image contrast, and object distribution might be adequate to develop the machine learning features to predict the emotion of graphic images. The machine learning method can calculate the emotional effects by considering the various combination of meaningful basic elements, which was not able to do in traditional statistics methods.
3. Feature Extraction of Movie Posters toward the Machine-Learning Algorithm Modelling
During the design workshop, we discovered the graphic elements people primarily consider to be distinguishing graphic images. Based on the observation and insight from the workshop, we tried to transform the attributes into numerical parameters, "features," as described in Appendix 1. For the feature extraction, we used library packages in R, an open-source-based programming language. In the feature value extraction process, we generally adopted averaged values for simple computation which people can relatively easily understand.
3. 1. Color related features
According to the results of the workshop, we developed features about the tendency of hue, brightness, and saturation, their variability, and profiles of palette colors. In this study, we utilize the CIE1976L*a*b* color system (CIELab hereinafter), because the CIELab is more linearly mapped to human color perception than other digital color systems, such as RGB, HSV, or HSL (CIE, 1976).
The central tendency of color indicates whether the average values of an image are different from those of another. From the JPEG format, we obtained the RGB values of all pixels contained in each image, converted them into the L, a, and b values, and averaged the results. The averaged L, a, and b figures represent the brightness, greenish–reddishness, and bluish–yellowishness of an image. The chroma (C hereinafter) value is calculated as the Euclidian distance from the orientation, where both a and b are zero. Thus, the averaged C value denotes the vividness of the image. The averaged values can be explained as white balance rather than individual color usage trends. The L, a, b, and C were obtained as mean values as well as standard deviation. The larger the standard deviations are, the larger the color differences within an image.
During the workshop, we confirmed that the palette colors were relevant in explaining the color characteristics of the poster images. Palette colors mean perceptually meaningful colors to explain the image characteristics; thus, it can include dominant colors as well as accent colors. Known as a color palette, a composition of the palette colors of an image is a well-adopted representative method to document the meaningful colors in the design field (Cho, Yun, Lee, & Choi, 2017; Jahanian, Keshvari, Vishwanathan, & Allebach, 2017).
To compose a color palette of each poster image, we performed the K-means analysis after having weighted vivid colors or original pixels. The K-means analysis is a method of vector quantization and aggregates observations into k number of clusters in which each observation belongs to the cluster with the nearest mean. We derived seven colors for each palette and computed both means and standard deviation of the L, a, b, and C values of the poster colors to be included as additional features. The existing web-based platforms for color palette extraction typically offer five colors, so we added two more colors to describe the color characteristics of the images more in detail.
Table 2 shows the values of both central color tendencies and palette color tendencies regarding two different posters. The values were standardized later for the machine learning estimation. Although the numbers representing central tendencies are different, palette color tendencies are shown similarly between two posters. Red text color at the bottom of “The King” poster was included in palette-colors since people show saliency in vivid colors.
Two posters with different values in color features
3. 2. Layout related elements: human and text
As observed in the design workshop, the human presence has a significant role in composing the layout of the image, and we adopted an algorithm to detect humans in this research. Also, participants perceived the title and other text areas as important elements. The human and text related considerations were not limited to the size of the area occupied by them. Their clustered locations and balance were meaningfully concerned.
To identify the areas of text and humans, we adopted deep learning techniques, such as Dual Shot Face Detector (DSFD) (Li et al., 2019), Character Region Awareness for Text Detection (CRAFT) (Baek, Lee, Han, Yun, & Lee, 2019) and Torchvision in Python. Those deep learning techniques were helpful in automatically identifying where humans and text were. However, deep learning-based human recognition is not yet feasible for understanding overlapped human images, unusual postures, and humanized figures such as animal characters in animations. Accordingly, we screened all results processed by the deep learning algorithms and modified some manually to correspond to how humans perceive the human, and text related features
Having utilized diverse techniques, we quantified the graphical elements from the posters. The layout features included were the quantity, area size, and location of objects: human, title and other texts. This led to exploring the object size, object position, object balance, and object dispersion in a graphic image. Object balance features describe how equally the objects are taken the position and size. Object dispersion features indicate how each object is far from the center of the image.
The detailed features are explained in Appendix 1. The feature values of two different layout posters are presented in Table 3. The values were standardized later for the machine learning estimation.
Two posters with different values in layout features. Human dominated poster (left) and test dominated poster(right).
3. 3. Other features
Additionally, the amount of edge in an image is proportional to the amount of contour within an image. Thus, little edge proportion implies that the graphic is made with simple planes, such as a simple geometric graphic style. We employed the Canny Edge function to estimate the value (Canny, 1986).
In sum, we composed a set of 35 features.
4. Algorithm modeling using machine-learning methods
4. 1. Method
We collected 320 movie posters for films released 2015–2019 in Korea from the Naver movie website. We extracted the 35 features, and all were of a size of around 310 by 440 pixels depending on their ratio. To build a training data set, three participants joined and assessed the poster image in terms of PAD emotional state model (PAD hereinafter). PAD is a well-known psychological model introduced by Mehrabian and Russell (1974) and has been widely adopted in a number of emotion studies. We asked them to assess them using the scale ‘disagree (-1)’, ‘neutral (0)’, or ‘agree (+1)’ regarding each of the Pleasure, Arousal, and Dominance (PAD) aspects.
The participants assessed the 320 posters repeatedly after a minimum time interval of five days. Considering a large number of posters, we allowed participants to spend time on assessment as much as they want. The assessment was individually processed in their own PC by utilizing image files and the given excel survey sheet.
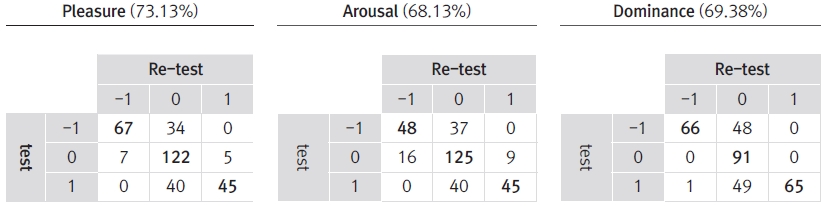
Having established a confusion matrix, we estimated the ratio of identical responses between the repeated judgments. For example, participant 1 (P1)’s confusion-matrix based accuracy in pleasure judgments of 320 poster images was 73.13%, as shown in Table 4.
The confusion matrix between repeated trials, the pleasure judgments of 320 poster images assessed by Participant 1(P1). Since the identical responses between two judgment sets are located diagonally, the accuracy corresponds to the ratio of the diagonal sum to the total.
In this way, we discovered the accuracy of humans’ emotional assessments of poster images ranged from 62.81% to 80.93%, as summarized in the first left column in Table 5. The recent machine-learning approaches showed the emotional quantity of images prediction accuracy as around 68% (Zhang et al., 2011) or approximately 67% (Swanson, Escoffery, & Jhala, 2012), suggesting that human emotions keep changing. In this study, the pleasure dimension shows the highest accuracy overall, followed by the dominance and arousal dimensions. We considered this accuracy as the baseline and labeled it as “human accuracy,” with an intention to compare it with the accuracy performance results from the machine learning later.
4. 2. Algorithm modeling
For the computation, firstly, we standardized the values of 35 features of 320 poster images. Then we averaged the repeated measurements from each participant to obtain the PAD dataset. Combining the feature values and the PAD set, we composed the full dataset and randomly divided it into training (80%) and test (20%) datasets. Using the machine learning-driven methods, we derived algorithms that predict outputs based on the feature values of the test dataset. Finally, the predicted outputs were compared with the PAD values of the original test dataset to calculate accuracy. Figure 4 illustrates the procedure of the study flow.

Flow of algorithm modeling for image-emotional prediction
We chose three classification methods, kknn, svmRadial, and C5.0, packaged in the Caret library in R. The kknn is a weighted K-nearest neighbor classifier which is considered a weighting scheme for the nearest neighbors according to their similarity (Hechenbichler & Schliep, 2004). This method is a type of instance-based learning and calculates the k-nearest neighbor of each row of the test set based on Minkowski distance. It is applicable to both nominal and continuous variables. svmRadial is the Radial Kernel Support Vector Machine. A support vector machine is a popular and powerful classification technique which simply generates hyperplanes or simply inputs lines, to classify the data for some feature spaces into different groups. C5.0 is a representative classification method that can describe a decision tree. This model is intuitive and easy to understand. The model details were developed by Quinlan (2014) and Kuhn and Johnson (2013).
Additionally, in modeling the algorithms, an automatic feature selection process was applied using the varSelRF library that successively eliminated the least important features. The computation, therefore, tackles a small number of high-impact features only instead of the entire 35 features. Consequently, we obtained an algorithm that is able to predict the emotional quantity in terms of PAD, when the selected features of image characteristics are identified. The algorithms were built for each of the PAD dimensions.
To examine the accuracy of the algorithms, we compared the predicted assessments with the actual assessments in the dataset. Because 20% of the test dataset was randomly composed, we trained and validated the data iteratively ten times and reported the averaged accuracy, respectively. As shown in Table 5, we present the accuracy sorted by the PAD dimensions, machine learning methods, and the participants. The accuracy is based on the confusion matrix. The averaged mean accuracies are listed with the achievement scores in parentheses. The achievement score is the ratio of machine learning accuracy to the human baseline. The algorithm modeling occurred ten times for each, considering the random operation in the computational procedure.
Accuracy (%) of the machine learning-driven algorithm and human baseline with regard to the PAD dimensions. Achievement scores (%) are in parentheses.
4. 3. Accuracy of machine learning-driven prediction
In order to examine the accuracy of predicted results, we consulted the confusion matrix between the predicted judgments and the actual assessments of the test dataset. As presented in Table 5, the accuracy rates achieved by the three methods are compared with the baseline. In general, the algorithm-based accuracy is lower in the pleasure dimension, while it is higher in the dominance dimension. Among the three methods, all accuracy performs similarly.
During the computation, we estimated the importance values of selected features in order to determine which graphical elements played essential roles. In this exploration process, we averaged the assessments of the three participants since the assessment data was highly correlated between individuals, as shown in Table 6. Interestingly, although dominance is usually a difficult assessment aspect, the judgments of people showed consistency compared to other psychological studies.
Pearson correlation coefficients between individual assessments regarding PAD aspects
Certain visual characteristics generally evoke some feelings in people. For example, we assumed that the poster images for negative stories might be colored using dark shades to address the tragic mood explicitly. Likewise, the average lightness should have contributed significantly to the mechanism of the modeled algorithm. Table 7 summarizes the top five features whose presence was highly influential in algorithm modeling. For example, the size of human feature was often utilized during the classification process of dominance models. Therefore, it should be essentially considered during the design process.
Top five presence features for individual PAD model
Nevertheless, the relationship between graphical features and PAD assessment results cannot be simply or linearly defined due to the characteristics of machine learning. During the classification process, the machine considers a variety of combinations and weights the feature values differently. To present a design guideline based on the machine learning result, therefore, the system which can generate the guideline for an input image should be developed.
5. Discussion and conclusion
We attempted to analyze emotional assessments of graphic images through the individually optimized machine learning models which adopted basic design features. Based on the results of the designer workshop (N=11), color and layout related essential features were taken into consideration. In particular, palette colors were additionally generated from the images, because the palette colors were better able to describe human visual salience than the averaged color values. Also, the sizes and locations of major objects were figured out.
Basically, we admitted the variability of human emotion, thereby referring to the humans’ repeated assessments as the baseline for accuracy achievement. For the machine learning algorithm modeling, we used three kinds of classification types of machine learning models, such as kknn, svmRadial, and C5.0. Compared to the human assessment baselines (62.81-80.93%), the prediction results (52.26%-80.32%) was relatively satisfactory.
However, this study was limited to a small quantity of data and did not yet consider the semantic features. By convention, machine learning models are developed based on large-scale data, usually provided from the public database or system. This study pursued an individual dataset to predict one’s emotional assessments regarding graphic images. Consequently, we conducted a survey to collect the necessary data: PAD assessments regarding the given movie posters. Yet, the process of the survey was not easy for participants due to the fatigue evoked by repeated assessments.
Additionally, semantic features need to be considered. In the workshop, the emotional state can be changed depending on the content of the image. For example, if one actor is holding a red rose and another actor is holding a bloody knife in two different images, the delivered message can vary regardless of their similar color and layout combinations. Although we attempted to figure out the impact of fundamental graphical elements on human emotional assessments, the semantic attributes may increase the prediction accuracy.
Nevertheless, this study demonstrated how design research can utilize AI-driven techniques to gather meaningful information relating to design practice by dealing with many graphical elements at once. This approach shows the possibility that the variety of combinations of design attributes can be computed. In this way, design research can be more rigorously conducted by utilizing the machine learning method.
Also, this study proposes a set of strategy to improve machine learning techniques in the field of image analysis, that involves developing machine learning features based on design theories and human observations. Still, investigating cause and effects should be meaningful to adopt the analysis result in the practical field. In this regard, this approach compensates for the latest trends which are relying on any automatic features pursuing a higher accuracy. This study demonstrated that simple but essential features can effectively derive the prediction results without a complex computation process. Based on the empirical findings, designers can adjust the image to deliver the message more effectively. Alternatively, an intelligent system can use the findings to modify graphic elements to enhance the target emotion. In this way, we expect an understanding of data-driven design will ultimately assist designers to work more efficiently.
Acknowledgments
This research was supported by the National Research Foundation of Korea funded by the MOE (21B20130011097) and the MSIT (2018R1A1A3A04078934).
Notes
Copyright : This is an Open Access article distributed under the terms of the Creative Commons Attribution Non-Commercial License (http://creativecommons.org/licenses/by-nc/3.0/), which permits unrestricted educational and non-commercial use, provided the original work is properly cited.
References
-
Ares, G., Arrúa, A., Antúnez, L., Vidal, L., Machín, L., Martínez, J., . . . Giménez, A. (2016). Influence of label design on children's perception of two snack foods: Comparison of rating and choice-based conjoint analysis. Food quality and preference, 53, 1-8.
[https://doi.org/10.1016/j.foodqual.2016.05.006]

-
Baek, Y., Lee, B., Han, D., Yun, S., & Lee, H. (2019). Character region awareness for text detection. Proceedings of the IEEE Conference on Computer Vision and Pattern Recognition, 9365-9374.
[https://doi.org/10.1109/CVPR.2019.00959]
-
Beyer, H., & Holtzblatt, K. (1999). Contextual design. interactions, 6(1), 32-42.
[https://doi.org/10.1145/291224.291229]
-
Canny, J. (1986). A computational approach to edge detection. IEEE Transactions on pattern analysis machine intelligence(6), 679-698.
[https://doi.org/10.1109/TPAMI.1986.4767851]
-
Cho, J., Yun, S., Lee, K. M., & Choi, J. Y. (2017). Palettenet: Image recolorization with given color palette. Proceedings of the ieee conference on computer vision and pattern recognition workshops, 62-70.
[https://doi.org/10.1109/CVPRW.2017.143]
- CIE. (1976). colorimetry part 4: Cie 1976 l* a* b* colour space. Commission internationale de l'eclairage proceedings, 1976.
-
Corchs, S., Fersini, E., & Gasparini, F. (2019). Ensemble learning on visual and textual data for social image emotion classification. International Journal of Machine Learning and Cybernetics, 10(8), 2057-2070.
[https://doi.org/10.1007/s13042-017-0734-0]
-
Daugman, J. G. (1980). Two-dimensional spectral analysis of cortical receptive field profiles. Vision research, 20(10), 847-856.
[https://doi.org/10.1016/0042-6989(80)90065-6]
-
Daugman, J. G. (1985). Uncertainty relation for resolution in space, spatial frequency, and orientation optimized by two-dimensional visual cortical filters. JOSA A, 2(7), 1160-1169.
[https://doi.org/10.1364/JOSAA.2.001160]
-
Dora, L., Agrawal, S., Panda, R., & Abraham, A. (2017). An evolutionary single Gabor kernel based filter approach to face recognition. Engineering Applications of Artificial Intelligence, 62, 286-301.
[https://doi.org/10.1016/j.engappai.2017.04.011]
-
Hamroun, M., Lajmi, S., Nicolas, H., & Amous, I. (2019). A new method of combining colour, texture and shape features using the genetic algorithm for image retrieval. International Journal of Multimedia Intelligence and Security, 3(3), 293-319.
[https://doi.org/10.1504/IJMIS.2019.104798]
-
Han, H., & Jung, J. (2019). 브랜드 로고의 형태재인 처리과정과 특성에 대한 연구. [Analyzing the Pattern Recognition of Brand Logo : Focusing on the Perception and Memory Process]. Archives of Design Research, 32(1), 115-128.
[https://doi.org/10.15187/adr.2019.02.32.1.115]
-
Hechenbichler, K., & Schliep, K. (2004). Weighted k-nearest-neighbor techniques and ordinal classification. Collaborative Research Center 386, Discussion Paper 399.
[https://doi.org/10.5282/ubm/epub.1769]
-
Hong, D., Lee, H., Yan, Y., & Suk, H.-J. (2019). Design Attributes for a More Eco-friendly Takeout Cup Using Conjoint Analysis. Archives of Design Research, 32(2), 57-68.
[https://doi.org/10.15187/adr.2019.05.32.2.57]
-
Jahanian, A., Keshvari, S., Vishwanathan, S., & Allebach, J. P. (2017). Colors—Messengers of Concepts: Visual Design Mining for Learning Color Semantics. ACM Transactions on Computer-Human Interaction, 24(1), 1-39.
[https://doi.org/10.1145/3009924]
- Kim, J., Kim, J., & Suk, H.-J. (2019). Layout Preference for Korean Movie Posters: Contextual Background or Character Dominance. IASDR 2019..
-
Köhler, W. (1967). Gestalt psychology. Psychological research, 31(1), XVIII-XXX.
[https://doi.org/10.1007/BF00422382]
-
Kuhn, M., & Johnson, K. (2013). Applied predictive modeling (Vol. 26). New York: Springer.
[https://doi.org/10.1007/978-1-4614-6849-3]
-
Kuzovkin, D., Pouli, T., Cozot, R., Le Meur, O., Kervec, J., & Bouatouch, K. (2018). Image selection in photo albums. Proceedings of the 2018 ACM on International Conference on Multimedia Retrieval, 397-404.
[https://doi.org/10.1145/3206025.3206077]
- Lauer, D. A., & Pentak, S. (1979). Design basics. Cengage Learning.
-
Li, J., Wang, Y., Wang, C., Tai, Y., Qian, J., Yang, J., ... & Huang, F. (2019). DSFD: dual shot face detector. In Proceedings of the IEEE Conference on Computer Vision and Pattern Recognition (pp. 5060-5069).
[https://doi.org/10.1109/CVPR.2019.00520]
-
Ma, N., Volkov, A., Livshits, A., Pietrusinski, P., Hu, H., & Bolin, M. (2019, January). An universal image attractiveness ranking framework. In 2019 IEEE Winter Conference on Applications of Computer Vision (WACV) (pp. 657-665). IEEE.
[https://doi.org/10.1109/WACV.2019.00075]
-
Majumdar, I., Chatterji, B., & Kar, A. (2020). A Moment Based Feature Extraction for Texture Image Retrieval. In Information, Photonics and Communication (pp. 167-177). Springer.
[https://doi.org/10.1007/978-981-32-9453-0_17]
- Mehrabian, A., & Russell, J. A. (1974). An approach to environmental psychology. the MIT Press.
-
Nazir, A., Ashraf, R., Hamdani, T., & Ali, N. (2018). Content based image retrieval system by using HSV color histogram, discrete wavelet transform and edge histogram descriptor. In 2018 International Conference on Computing, Mathematics and Engineering Technologies (iCoMET) (pp. 1-6).
[https://doi.org/10.1109/ICOMET.2018.8346343]
-
Palmer, S. E., & Guidi, S. (2011). Mapping the perceptual structure of rectangles through goodness-of-fit ratings. Perception, 40(12), 1428-1446.
[https://doi.org/10.1068/p7021]
- Quinlan, J. R. (2014). C4. 5: programs for machine learning. Elsevier.
-
Ren, J., Shen, X., Lin, Z., Mech, R., & Foran, D. J. (2017). Personalized image aesthetics. In Proceedings of the IEEE International Conference on Computer Vision (pp. 638-647).
[https://doi.org/10.1109/ICCV.2017.76]
-
Soundes, B., Larbi, G., & Samir, Z. (2019). Pseudo Zernike moments-based approach for text detection and localisation from lecture videos. International Journal of Computational Science, 19(2), 274-283.
[https://doi.org/10.1504/IJCSE.2019.100231]
-
Swanson, R., Escoffery, D., & Jhala, A. (2012). Learning visual composition preferences from an annotated corpus generated through gameplay. 2012 IEEE Conference on Computational Intelligence and Games (CIG), 363-370.
[https://doi.org/10.1109/CIG.2012.6374178]
-
Wang, Z., Duff, B. R., & Clayton, R. B. (2018). Establishing a factor model for aesthetic preference for visual complexity of brand logo. Journal of Current Issues Research in Advertising, 39(1), 83-100.
[https://doi.org/10.1080/10641734.2017.1372325]
-
Zernike, V. F. (1934). Beugungstheorie des schneidenver-fahrens und seiner verbesserten form, der phasenkontrastmethode. physica, 1, 689-704.
[https://doi.org/10.1016/S0031-8914(34)80259-5]
-
Zhang, H., Augilius, E., Honkela, T., Laaksonen, J., Gamper, H., & Alene, H. (2011). Analyzing emotional semantics of abstract art using low-level image features. International Symposium on Intelligent Data Analysis, 413-423.
[https://doi.org/10.1007/978-3-642-24800-9_38]
-
Zhao, S., Yao, H., Gao, Y., Ding, G., & Chua, T.-S. (2016). Predicting personalized image emotion perceptions in social networks. IEEE transactions on affective computing, 9(4), 526-540.
[https://doi.org/10.1109/TAFFC.2016.2628787]
-
Zhao, S., Zhao, X., Ding, G., & Keutzer, K. (2018). EmotionGAN: Unsupervised domain adaptation for learning discrete probability distributions of image emotions. Proceedings of the 26th ACM international conference on Multimedia, 1319-1327.
[https://doi.org/10.1145/3240508.3240591]